ガンマ回帰とは
ガンマ回帰とは、観察された事象をガンマ分布で表現するときに使うGLMです。ガンマ分布のリンク関数はlogリンク関数が使われることが多いです。
ガンマ回帰モデルの構築
実際にガンマ回帰モデルを構築してみます。今回は、scikit-learnの Boston Housing Dataset を使用します。
import pandas as pd
import numpy as np
from sklearn.datasets import load_boston

boston = load_boston()
X = boston.data
y = boston.target

df = pd.DataFrame(X, columns = boston.feature_names).assign(MEDV=np.array(y))
df = df[['RM', 'MEDV']]
display(df.head())
| RM | MEDV | |
|---|---|---|
| 0 | 6.575 | 24.0 |
| 1 | 6.421 | 21.6 |
| 2 | 7.185 | 34.7 |
| 3 | 6.998 | 33.4 |
| 4 | 7.147 | 36.2 |
それぞれのカラムの意味は次のとおりです。
- MEDV: 1000ドルでの所有者居住住宅の中央値
- RM: 1住戸あたりの平均部屋数
データの確認
記述統計量を確認します。
df.describe()
| RM | MEDV | |
|---|---|---|
| count | 506.000000 | 506.000000 |
| mean | 6.284634 | 22.532806 |
| std | 0.702617 | 9.197104 |
| min | 3.561000 | 5.000000 |
| 25% | 5.885500 | 17.025000 |
| 50% | 6.208500 | 21.200000 |
| 75% | 6.623500 | 25.000000 |
| max | 8.780000 | 50.000000 |
散布図を表示します。
import matplotlib.pyplot as plt
import seaborn as sns
%matplotlib inline

plt.figure(figsize=(10,5))
sns.set(rc={'figure.figsize':(10,5)})

sns.scatterplot(x='RM', y='MEDV', data=df)

モデルの構築
MEDVがガンマ分布に従うと仮定します。、今回は平均のMEDVを
| モデル | log link 関数 |
|---|---|
| モデル 1 | |
| モデル 2 |
パラメータ推定(モデル 1)
import statsmodels.formula.api as smf
import statsmodels.api as sm

fit = smf.glm(formula='MEDV ~ RM', data=df, family=sm.families.Gamma(link=sm.families.links.log)).fit()
fit.summary()
次の結果が得られました。
| GLM Results | |||
|---|---|---|---|
| Dep. Variable | MEDV | No. Observations | 506 |
| Model | GLM | Df Residuals | 504 |
| Model Family | Gamma | Df Model | 1 |
| Link Function | log | Scale: | 0.096893 |
| Method | IRLS | Log-Likelihood | -1658.9 |
| Date | Wed, 28 Dec 2022 | Deviance: | 47.467 |
| Time | 02:50:46 | Pearson chi2 | 48.8 |
| No. Iterations | 15 | Covariance Type | nonrobust |
| coef | std err | z | P>|z| | [0.025 | 0.975] | |
|---|---|---|---|---|---|---|
| Intercept | 0.9379 | 0.125 | 7.524 | 0.000 | 0.694 | 1.182 |
| RM | 0.3411 | 0.020 | 17.300 | 0.000 | 0.302 | 0.380 |
AIC を導出します。
fit.aic

3321.8747164073784
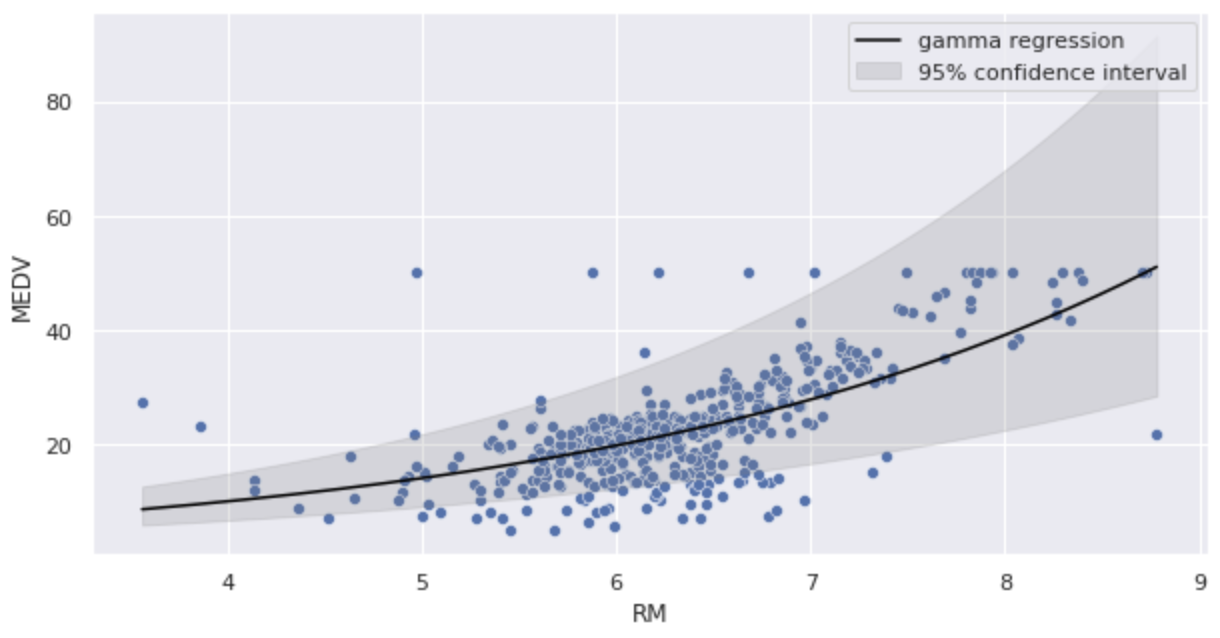
推定したパラメータをガンマ回帰モデルに代入し、図示してみます。
import numpy as np
import math

sns.scatterplot(x='RM', y='MEDV', data=df)
x = np.arange(df.RM.min(), df.RM.max() + 0.01, 0.01)
y = np.exp(fit.params['Intercept'] + fit.params['RM'] * x)
y_lower = np.exp((fit.conf_int().loc['Intercept'][0]) + fit.conf_int().loc['RM'][0] * x)
y_upper = np.exp((fit.conf_int().loc['Intercept'][1]) + fit.conf_int().loc['RM'][1] * x)
plt.plot(x, y, color='black', label='gamma regression')
plt.fill_between(x, y_lower, y_upper, color='grey', alpha=0.2, label='95% confidence interval')
plt.legend()
plt.show()

logリンク関数であるため、右肩上がりの曲線で予測されていることが分かります。
パラメータ推定(モデル 2)
glm関数のformulaはformula='MEDV ~ np.log(RM)'と記述しています。
import statsmodels.formula.api as smf
import statsmodels.api as sm

fit = smf.glm(formula='MEDV ~ np.log(RM)', data=df, family=sm.families.Gamma(link=sm.families.links.log)).fit()
fit.summary()
| GLM Results | |||
|---|---|---|---|
| Dep. Variable | MEDV | No. Observations | 506 |
| Model | GLM | Df Residuals | 504 |
| Model Family | Gamma | Df Model | 1 |
| Link Function | log | Scale: | 0.10838 |
| Method | IRLS | Log-Likelihood | -1675.8 |
| Date | Wed, 28 Dec 2022 | Deviance: | 50.505 |
| Time | 02:50:46 | Pearson chi2 | 54.6 |
| No. Iterations | 22 | Covariance Type | nonrobust |
| coef | std err | z | P>|z| | [0.025 | 0.975] | |
|---|---|---|---|---|---|---|
| Intercept | -0.5489 | 0.239 | -2.293 | 0.022 | -1.018 | -0.080 |
| np.log(RM) | 1.9834 | 0.130 | 15.208 | 0.000 | 1.728 | 2.239 |
AICを導出します。
fit.aic

3355.6367279321394
AICはモデル1よりも大きくなっています。
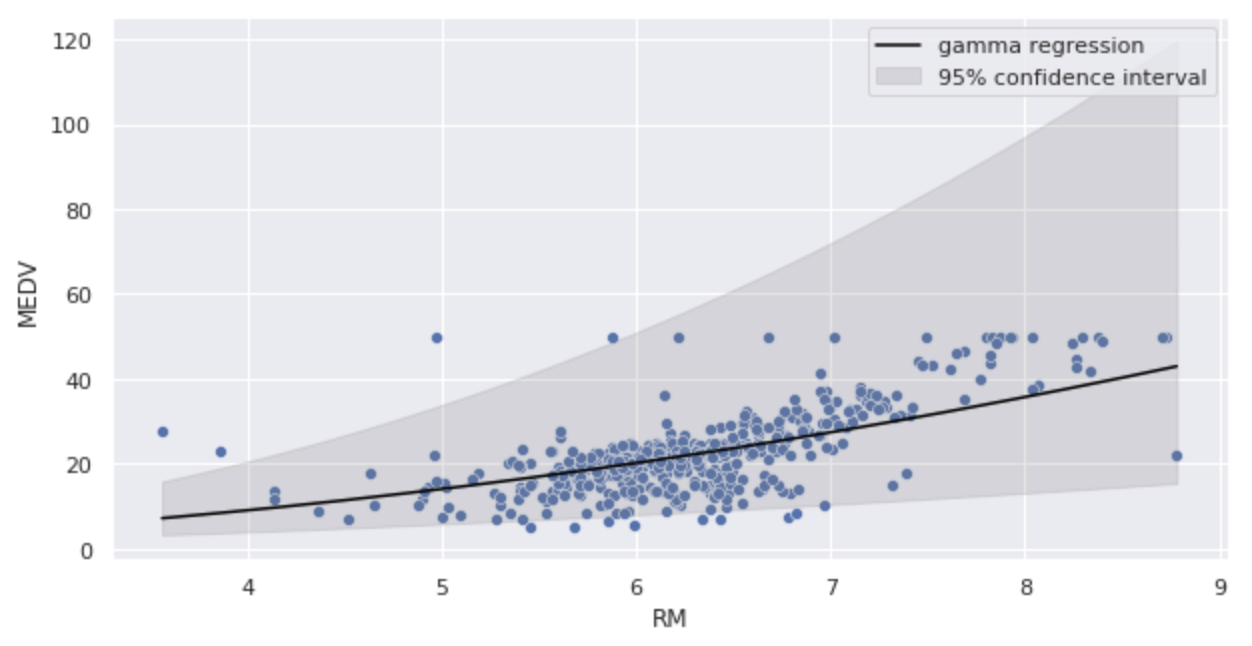
推定したパラメータをガンマ回帰モデルに代入し、図示してみます。
import numpy as np
import math

sns.scatterplot(x='RM', y='MEDV', data=df)
x = np.arange(df.RM.min(), df.RM.max() + 0.01, 0.01)
y = np.exp(fit.params['Intercept'] + fit.params['np.log(RM)'] * np.log(x))
y_lower = np.exp((fit.conf_int().loc['Intercept'][0]) + fit.conf_int().loc['np.log(RM)'][0] * np.log(x))
y_upper = np.exp((fit.conf_int().loc['Intercept'][1]) + fit.conf_int().loc['np.log(RM)'][1] * np.log(x))
plt.plot(x, y, color='black', label='gamma regression')
plt.fill_between(x, y_lower, y_upper, color='grey', alpha=0.2, label='95% confidence interval')
plt.legend()
plt.show()

モデル1のよりも曲線の傾きが緩やかになっています。
AlloyDB
Amazon Cognito
Amazon EC2
Amazon ECS
Amazon QuickSight
Amazon RDS
Amazon Redshift
Amazon S3
API
Autonomous Vehicle
AWS
AWS API Gateway
AWS Chalice
AWS Control Tower
AWS IAM
AWS Lambda
AWS VPC
BERT
BigQuery
Causal Inference
ChatGPT
Chrome Extension
CircleCI
Classification
Cloud Functions
Cloud IAM
Cloud Run
Cloud Storage
Clustering
CSS
Data Engineering
Data Modeling
Database
dbt
Decision Tree
Deep Learning
Descriptive Statistics
Differential Equation
Dimensionality Reduction
Discrete Choice Model
Docker
Economics
FastAPI
Firebase
GIS
git
GitHub
GitHub Actions
Google
Google Cloud
Google Search Console
Hugging Face
Hypothesis Testing
Inferential Statistics
Interval Estimation
JavaScript
Jinja
Kedro
Kubernetes
LightGBM
Linux
LLM
Mac
Machine Learning
Macroeconomics
Marketing
Mathematical Model
Meltano
MLflow
MLOps
MySQL
NextJS
NLP
Nodejs
NoSQL
ONNX
OpenAI
Optimization Problem
Optuna
Pandas
Pinecone
PostGIS
PostgreSQL
Probability Distribution
Product
Project
Psychology
Python
PyTorch
QGIS
R
ReactJS
Regression
Rideshare
SEO
Singer
sklearn
Slack
Snowflake
Software Development
SQL
Statistical Model
Statistics
Streamlit
Tabular
Tailwind CSS
TensorFlow
Terraform
Transportation
TypeScript
Urban Planning
Vector Database
Vertex AI
VSCode
XGBoost