


Permutation Importanceとは
Permutation Importanceは、機械学習の分野で、予測モデルの特徴量の関連性を理解するために使用される技術です。各特徴量がモデルのパフォーマンスに与える影響を推定することで、データサイエンティストはもっとも重要な特徴量を特定し、モデルの構築や改良において的確な判断を下すことができます。
Permutation Importanceの計算方法
数学において、Permutationとはオブジェクトを特定の順序で配置することを指します。Permutation Importanceにおいては、Permutationはデータセット内の特徴量の値をランダムにシャッフルし、他の特徴量を変更しないことを指します。このシャッフルプロセスにより、特徴量がモデルのパフォーマンスに与える影響を評価できます。そのため、正確性などのメトリックの損失は、特徴量の値の変動に起因すると考えることができます。
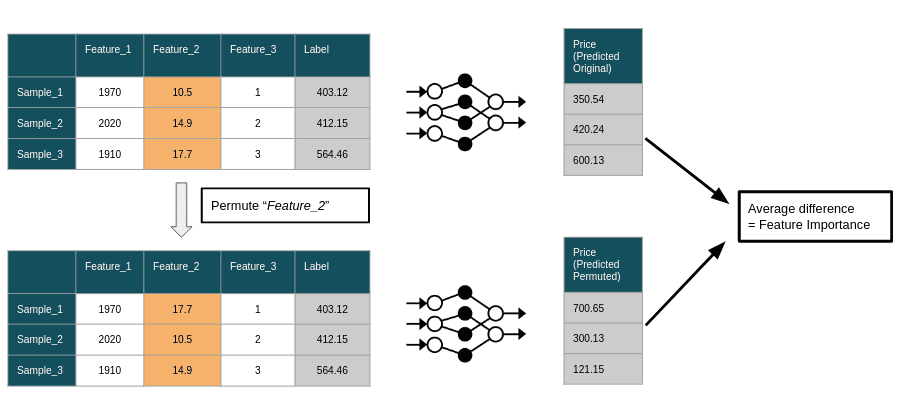
Permutation Importanceの計算には、次の手順があります。
-
モデルをトレーニング
選択した評価メトリックと損失関数を使用して、機械学習モデルを元のデータセットに適合させます。 -
ベースラインのパフォーマンスを評価
元のデータセットでモデルのパフォーマンスを評価し、ベースラインメトリックの値を記録します。 -
特徴量を置換
データセット内の1つの特徴量の値をランダムにシャッフルし、他の特徴量を変更しないようにします。 -
パフォーマンスを再評価
パーテューブされたデータセットでモデルのパフォーマンスを評価し、パーテューブされたデータセットと元のデータセットのメトリック値の違いを計算します。 -
ステップ3-4を繰り返す
データセット内の各特徴量をシャッフルして評価し、各置換のパフォーマンスの変化を記録します。 -
重要度スコアを計算
各特徴量の複数の反復にわたるパフォーマンスの変化を平均します。 -
特徴量をランク付け
重要度スコアに基づいて、特徴量を降順にソートします。
カテゴリカル変数の扱い方
Permutation Importanceは、カテゴリカル変数に対しても適用できます。各カテゴリー内で置換を実行することで、変数の重要性を評価することができます。ただし、カテゴリの数やデータセット内での分布によって重要度スコアに影響を与える可能性があるため、結果を解釈する際には注意が必要です。
PythonでPermutation Importanceの可視化
この章では、カリフォルニアの住宅データセットを用いて、Permutation Importanceの可視化方法を紹介します。
カリフォルニアの住宅データセットには、中央収入、住宅の中央年齢、1軒あたりの平均部屋数などの特徴量が含まれています。目的変数は中央家賃です。
まず、データセットをロードしてトレーニングセットとテストセットに分割します。
from sklearn.datasets import fetch_california_housing
from sklearn.model_selection import train_test_split

data = fetch_california_housing()
X, y = data.data, data.target
X_train, X_test, y_train, y_test = train_test_split(X, y, test_size=0.2, random_state=42)
この例では、ランダムフォレスト回帰器をトレーニングします。
from sklearn.ensemble import RandomForestRegressor

model = RandomForestRegressor(n_estimators=100, random_state=42)
model.fit(X_train, y_train)
sklearnのpermutation_importance関数を使用して、各特徴量のPermutation Importanceを計算できます。
from sklearn.inspection import permutation_importance

result = permutation_importance(model, X_test, y_test, n_repeats=10, random_state=42)
permutation_importance関数のn_repeatsパラメータは、データセット内の各特徴量に対して置換プロセスを繰り返す回数を決定します。
matplotlibとseabornを使用して、各特徴量のPermutation Importanceをバープロットで可視化できます。
import numpy as np
import matplotlib.pyplot as plt
import seaborn as sns

# Sort the features by importance
sorted_idx = result.importances_mean.argsort()

# Create a horizontal bar plot
plt.figure(figsize=(10, 6))
sns.barplot(x=result.importances_mean[sorted_idx], y=np.array(data.feature_names)[sorted_idx], palette='viridis')

# Add error bars to show the standard deviation of the importance scores
plt.errorbar(x=result.importances_mean[sorted_idx], y=np.arange(len(sorted_idx)),
             xerr=result.importances_std[sorted_idx], fmt='o', capsize=5, color='black')

# Set the plot title and labels
plt.title('Permutation Importance of Features')
plt.xlabel('Importance Score')
plt.ylabel('Feature')
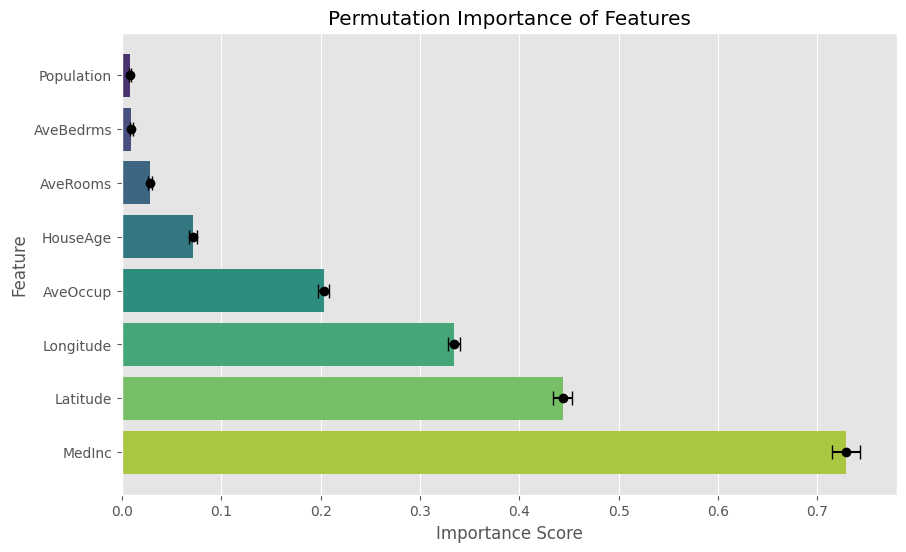
この可視化により、カリフォルニアの住宅データセットの各特徴量のPermutation Importanceスコアとその標準偏差が明確に表示されます。プロットを確認することで、中央収入であるMedIncがもっとも重要な特徴量であることがわかります。
参考


Ryusei Kakujo


Weave the future of cities through data
Transportation modeling/ Urban planning/ Machine learning/ Computer science/ GIS