
クロスバリデーションとは
クロスバリデーションは、機械学習や統計モデリングにおいて、予測モデルの性能を独立したデータセット上で評価するための技術です。このプロセスは、データセットを2つのサブセットに分割することから始まります。1つは、モデルのトレーニングに使用されるトレーニングセットであり、もう1つは、モデルの性能をテストするために使用されるバリデーションセットです。
クロスバリデーションの目的は、モデルが新しいデータに対してどの程度一般化できるかを評価することです。トレーニングセットとは別のバリデーションセットを使用することで、クロスバリデーションは、モデルが過剰適合を防止し、トレーニングデータ上ではよく機能するが、新しい未知のデータでは性能が低下するような複雑なモデルを防ぎます。
クロスバリデーションの重要性
クロスバリデーションは、機械学習や統計モデリングにおいて次の理由から重要な技術です。
-
正確なモデル選択
クロスバリデーションは、候補モデルの集合から最適なモデルを選択するために使用され、各モデルが新しい未知のデータ上でどの程度良く機能するかを推定します。これは重要なことであり、トレーニングデータ上では良好な性能を示しても、新しいデータでは役に立たないモデルは実用的ではありません。 -
頑健性と汎化
クロスバリデーションは、モデルが過剰適合を防止し、新しいデータに対して頑健で一般化できるようにすることで、モデルが頑健であることを確認するのに役立ちます。過剰適合は、モデルが複雑すぎて、トレーニングデータ中のノイズにフィットしてしまい、新しいデータで性能が低下する現象です。 -
過剰適合の識別
クロスバリデーションによって、モデルが過剰適合しているかどうかを識別することができます。これにより、モデルの複雑さを調整してパフォーマンスを向上させることができます。 -
データ漏洩の回避
クロスバリデーションによって、バリデーションセットの情報がトレーニングプロセスで使用されるデータ漏洩を回避できます。データ漏洩は、モデルのパフォーマンスを過大評価し、不正確な結果をもたらす可能性があります。
以下に、現実の例を示します。
顧客の購入履歴、人口統計、その他の要因に基づいて、顧客が離反する可能性があるかどうかを予測する機械学習モデルを構築するとします。10000人の顧客データがあり、うち1000人が離反しています。
単にデータセットをランダムにトレーニングセットとテストセットに分割した場合、テストセットにあまりにも少数の離反した顧客が含まれてしまい、不正確なパフォーマンスメトリックが得られる可能性があります。例えば、テストセットに離反顧客が5%しか含まれていない場合、離反する顧客がいないと予測するモデルでも95%の精度が得られますが、実際には役に立ちません。
クロスバリデーションを使用することで、全ての分割において離反顧客の比率が一貫していることを確認し、パフォーマンスメトリックがより正確かつ信頼性の高いものになることができます。例えば、比率が同じであることを確認するために、層化k分割交差検証を5分割で使用することができます。
さらに、クロスバリデーションを使用することで、オーバーフィッティングやアンダーフィッティングの問題を特定し、モデルを適切に調整することができます。例えば、モデルがトレーニングセットではうまく機能しているが、テストセットではうまく機能していない場合は、モデルの複雑さを減らしたり、正則化を追加したりしてオーバーフィッティングを防止する必要があります。
クロスバリデーションの種類
機械学習や統計モデリングで一般的に使用されるクロスバリデーションには、いくつかの種類があります。
ホールドアウト法
ホールドアウト法は、データセットをトレーニングセットとテストセットの2つのサブセットに分割してモデルをトレーニングおよびテストするクロスバリデーションの一種です。ホールドアウト法は簡単で実装が容易ですが、k-foldクロスバリデーションなどの他のクロスバリデーション技術と比較して信頼性が劣る場合があります。
以下は、scikit-learnライブラリを使用してホールドアウト法を実装するためのPython例コードの例です。
from sklearn.datasets import load_iris
from sklearn.model_selection import train_test_split
from sklearn.neighbors import KNeighborsClassifier

# Load the iris dataset
iris = load_iris()

# Split the dataset into training and testing sets
X_train, X_test, y_train, y_test = train_test_split(iris.data, iris.target, test_size=0.3)

# Train a k-nearest neighbors classifier on the training set
knn = KNeighborsClassifier(n_neighbors=5)
knn.fit(X_train, y_train)

# Evaluate the performance of the classifier on the testing set
score = knn.score(X_test, y_test)
print('Accuracy:', score)
この例では、scikit-learnのload_iris()関数を使用してアヤメのデータセットをロードします。次に、 train_test_split()関数を使用して、テストサイズが0.3(データの30%がテストに使用される)のトレーニングセットとテストセットに分割します。
次に、scikit-learnのKNeighborsClassifier()関数を使用して、トレーニングセットでk最近傍分類器をトレーニングします。最後に、 score()メソッドを使用して、テストセットでの分類器の精度を評価します。
Leave-One-Out 交差検証
Leave-One-Out交差検証(LOOCV)は、データセット内のサンプル数と同じ数のフォールドを持つ交差検証の一種です。LOOCVでは、モデルは1つを除く全てのサンプルでトレーニングされ、1つはテストに使用されます。このプロセスは、データセット内の各サンプルについて繰り返され、パフォーマンスメトリックは全てのフォールドで平均されてモデルのパフォーマンスが評価されます。
以下は、scikit-learnライブラリを使用してLOOCVを実装するPythonコードの例です。
from sklearn.datasets import load_iris
from sklearn.model_selection import LeaveOneOut
from sklearn.neighbors import KNeighborsClassifier

# Load the iris dataset
iris = load_iris()

# Initialize the LOOCV iterator
loo = LeaveOneOut()

# Train and test the model on each sample
scores = []
for train_idx, test_idx in loo.split(iris.data):
    # Get the training and testing data for this sample
    X_train, y_train = iris.data[train_idx], iris.target[train_idx]
    X_test, y_test = iris.data[test_idx], iris.target[test_idx]

    # Train a k-nearest neighbors classifier on the training set
    knn = KNeighborsClassifier(n_neighbors=5)
    knn.fit(X_train, y_train)

    # Evaluate the performance of the classifier on the testing set
    score = knn.score(X_test, y_test)
    scores.append(score)

# Calculate the average performance metric over all samples
accuracy = sum(scores) / len(scores)
print('Accuracy:', accuracy)
この例では、scikit-learnのload_iris()関数を使用してアヤメのデータセットをロードします。次に、LeaveOneOut()関数を使用してLOOCVイテレータを初期化します。
次に、データセットの各サンプルをループして、それぞれに対応するトレーニングデータとテストデータでモデルをトレーニングおよびテストします。LOOCVイテレータのsplit()メソッドを使用して各サンプルのトレーニングデータとテストデータのインデックスを取得します。
次に、トレーニングセットでk近傍法分類器をトレーニングし、score()メソッドを使用してテストセットでのパフォーマンスを評価します。パフォーマンスメトリックをスコアリストに追加します。
最後に、スコアを合計し、データセットのサンプル数で割ることで、全てのサンプルに対する平均パフォーマンスメトリックを計算します。
K-fold 交差検証
K-fold交差検証は、機械学習におけるクロスバリデーションの広く使用される技術の1つです。K-fold cross validationでは、データセットをK個の同じサイズのフォールドに分割し、モデルをK回トレーニングおよびテストします。各回で、1つのフォールドをテスト用に使用し、残りのK-1個のフォールドをトレーニングに使用します。これにより、モデルがデータセットの全ての部分でトレーニングおよびテストされ、パフォーマンスメトリックがより正確で信頼性が高くなることが期待できます。
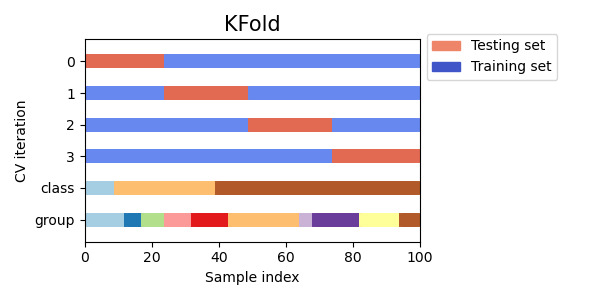
Visualizing cross-validation behavior in scikit-learn
from sklearn.datasets import load_iris
from sklearn.model_selection import KFold
from sklearn.neighbors import KNeighborsClassifier

# Load the iris dataset
iris = load_iris()

# Define the number of folds for K-fold cross validation
num_folds = 5

# Initialize the K-fold cross validation iterator
kf = KFold(n_splits=num_folds, shuffle=True)

# Train and test the model on each fold
for fold, (train_idx, test_idx) in enumerate(kf.split(iris.data)):
    # Get the training and testing data for this fold
    X_train, y_train = iris.data[train_idx], iris.target[train_idx]
    X_test, y_test = iris.data[test_idx], iris.target[test_idx]

    # Train a k-nearest neighbors classifier on the training set
    knn = KNeighborsClassifier(n_neighbors=5)
    knn.fit(X_train, y_train)

    # Evaluate the performance of the classifier on the testing set
    score = knn.score(X_test, y_test)
    print('Fold:', fold, 'Accuracy:', score)
最後に、各分割の分類器の精度を出力します。
グループ K-fold 交差検証
グループK-fold交差検証は、同じグループからのデータサンプルがトレーニングセットとテストセットの両方に存在しないようにする、K-fold交差検証のバリアントです。これは、異なる患者からの医療データや、異なる企業からの財務データなど、関連するグループにデータが分割されている場合に有用です。
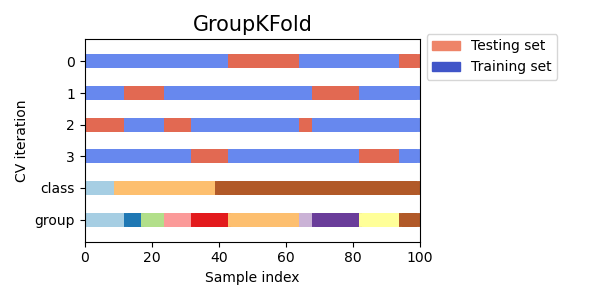
Visualizing cross-validation behavior in scikit-learn
from sklearn.model_selection import GroupKFold
from sklearn.datasets import make_classification
from sklearn.linear_model import LogisticRegression

# Generate example data with 3 groups
X, y = make_classification(n_samples=100, n_features=10, n_informative=5, n_redundant=0, n_classes=2, random_state=42)
groups = [0, 0, 0, 1, 1, 1, 2, 2, 2, 2]

# Create Group K-fold object with 3 folds
gkf = GroupKFold(n_splits=3)

# Iterate over splits and train/test the model
for train_index, test_index in gkf.split(X, y, groups=groups):
    X_train, X_test = X[train_index], X[test_index]
    y_train, y_test = y[train_index], y[test_index]

    # Fit model on training data
    model = LogisticRegression().fit(X_train, y_train)

    # Evaluate model on testing data
    score = model.score(X_test, y_test)
    print("Accuracy score: ", score)
シャッフル分割交差検証
シャッフル分割交差検証は、データをランダムに複数回トレーニングセットとテストセットに分割する方法であり、他の交差検証方法よりもトレーニングセットとテストセットのサイズに対する制御がより可能です。
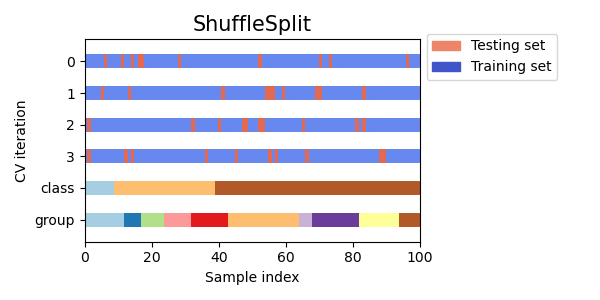
Visualizing cross-validation behavior in scikit-learn
from sklearn.model_selection import ShuffleSplit
from sklearn.datasets import make_classification
from sklearn.linear_model import LogisticRegression

# Generate example data
X, y = make_classification(n_samples=100, n_features=10, n_informative=5, n_redundant=0, n_classes=2, random_state=42)

# Create Shuffle Split object with 5 splits and a 0.5 test size
ss = ShuffleSplit(n_splits=5, test_size=0.5)

# Iterate over splits and train/test the model
for train_index, test_index in ss.split(X, y):
    X_train, X_test = X[train_index], X[test_index]
    y_train, y_test = y[train_index], y[test_index]

    # Fit model on training data
    model = LogisticRegression().fit(X_train, y_train)

    # Evaluate model on testing data
    score = model.score(X_test, y_test)
    print("Accuracy score: ", score)
層化 K-fold 交差検証
層化k-fold交差検証は、データをkの分割に分割しますが、各分割がデータセット全体と同じクラスのサンプルの比率をほぼ同じにするようにします。これは、1つのクラスが他のクラスよりもはるかに多いような不均衡なデータセットを扱う場合に特に有用です。
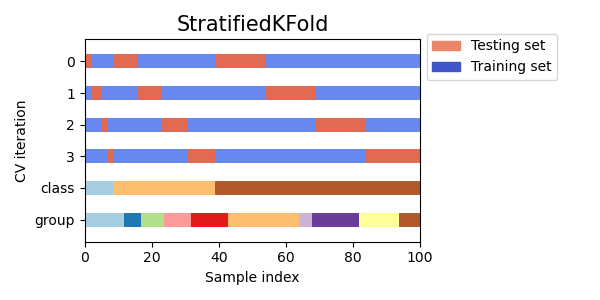
Visualizing cross-validation behavior in scikit-learn
from sklearn.model_selection import StratifiedKFold
from sklearn.datasets import make_classification
from sklearn.linear_model import LogisticRegression

# Generate example data
X, y = make_classification(n_samples=100, n_features=10, n_informative=5, n_redundant=0, n_classes=2, random_state=42)

# Create Stratified K-fold object with 5 splits
skf = StratifiedKFold(n_splits=5)

# Iterate over splits and train/test the model
for train_index, test_index in skf.split(X, y):
    X_train, X_test = X[train_index], X[test_index]
    y_train, y_test = y[train_index], y[test_index]

    # Fit model on training data
    model = LogisticRegression().fit(X_train, y_train)

    # Evaluate model on testing data
    score = model.score(X_test, y_test)
    print("Accuracy score: ", score)
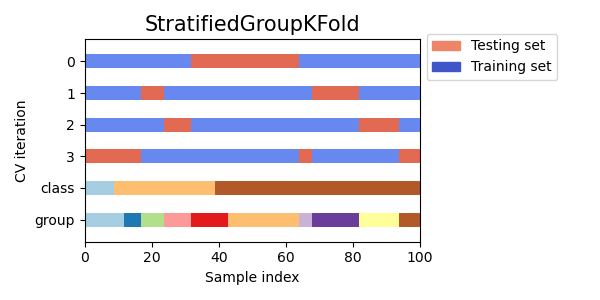
層化グループ K-fold 交差検証
層化グループK-fold交差検証は、クラスラベルに加えてグループを考慮したK分割交差検証のバリエーションです。データをk個のフォールドに分割し、各フォールドが各クラスから同じ比率のサンプルだけでなく、各グループからも同じ比率のサンプルを持つようにします。
Visualizing cross-validation behavior in scikit-learn
from sklearn.model_selection import GroupKFold, StratifiedKFold
from sklearn.datasets import make_classification
from sklearn.linear_model import LogisticRegression

# Generate example data with group labels
X, y = make_classification(n_samples=100, n_features=10, n_informative=5, n_redundant=0, n_classes=2, random_state=42)
groups = [i % 5 for i in range(len(X))] # Assign groups based on remainder of index

# Create Stratified Group K-fold object with 5 splits
skf = StratifiedKFold(n_splits=5)
sgkf = [(train_index, test_index) for train_index, test_index in skf.split(X, y)]

# Use Group K-fold to ensure each fold has the same groups as in the entire dataset
sgkf = [(train_index, test_index) for train_index, test_index in GroupKFold(n_splits=5).split(X, y, groups=groups)]

# Iterate over splits and train/test the model
for train_index, test_index in sgkf:
    X_train, X_test = X[train_index], X[test_index]
    y_train, y_test = y[train_index], y[test_index]

    # Fit model on training data
    model = LogisticRegression().fit(X_train, y_train)

    # Evaluate model on testing data
    score = model.score(X_test, y_test)
    print("Accuracy score: ", score)
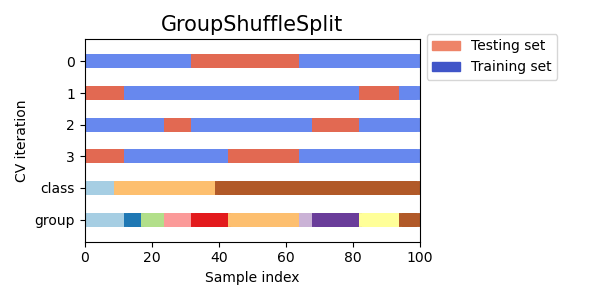
グループシャッフルスプリット交差検証
グループシャッフルスプリット交差検証は、クラスラベルに加えてグループを考慮し、データをランダムにシャッフルしてトレーニングセットとテストセットに分割する交差検証の変種です。これは、不均衡なデータセットや時系列データのように、データポイントの順序が重要な場合に役立ちます。
Visualizing cross-validation behavior in scikit-learn
from sklearn.model_selection import GroupShuffleSplit
from sklearn.datasets import make_classification
from sklearn.linear_model import LogisticRegression

# Generate example data with group labels
X, y = make_classification(n_samples=100, n_features=10, n_informative=5, n_redundant=0, n_classes=2, random_state=42)
groups = [i % 5 for i in range(len(X))] # Assign groups based on remainder of index

# Create Group Shuffle Split object with 80/20 split
gss = GroupShuffleSplit(n_splits=5, test_size=0.2)

# Iterate over splits and train/test the model
for train_index, test_index in gss.split(X, y, groups=groups):
    X_train, X_test = X[train_index], X[test_index]
    y_train, y_test = y[train_index], y[test_index]

    # Fit model on training data
    model = LogisticRegression().fit(X_train, y_train)

    # Evaluate model on testing data
    score = model.score(X_test, y_test)
    print("Accuracy score: ", score)
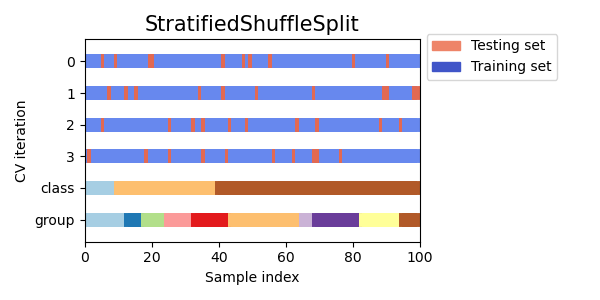
層化シャッフル分割交差検証
層化シャッフル分割交差検証は層化とシャッフルを組み合わせた交差検証の手法です。層化は各分割でクラスの比率が保持されるようにし、シャッフルはサンプルの順序をランダムにします。この技術は、データが不均衡である場合や、データポイントの順序が重要な場合に有用です。
Visualizing cross-validation behavior in scikit-learn
from sklearn.model_selection import StratifiedShuffleSplit
from sklearn.datasets import make_classification
from sklearn.linear_model import LogisticRegression

# Generate example data with two classes
X, y = make_classification(n_samples=100, n_features=10, n_informative=5, n_redundant=0, n_classes=2, random_state=42)

# Create Stratified Shuffle Split object with 80/20 split
sss = StratifiedShuffleSplit(n_splits=5, test_size=0.2, random_state=42)

# Iterate over splits and train/test the model
for train_index, test_index in sss.split(X, y):
    X_train, X_test = X[train_index], X[test_index]
    y_train, y_test = y[train_index], y[test_index]

    # Fit model on training data
    model = LogisticRegression().fit(X_train, y_train)

    # Evaluate model on testing data
    score = model.score(X_test, y_test)
    print("Accuracy score: ", score)
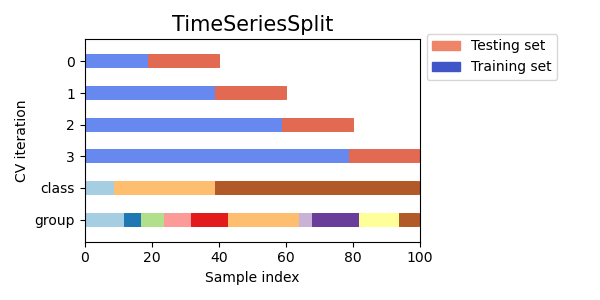
時系列交差検証
時系列データを対象としたクロスバリデーションの一種であり、過去の観測値に基づいて将来の値を予測することが目的です。この方法では、トレーニングセットは過去の観測値で構成され、テストセットは将来の観測値で構成されます。
Visualizing cross-validation behavior in scikit-learn

Forecasting at Uber: An Introduction
import pandas as pd
from sklearn.model_selection import TimeSeriesSplit
from sklearn.linear_model import LinearRegression

# Load the dataset
data = pd.read_csv('time_series_data.csv')

# Set the target variable
target_variable = 'sales'

# Set the number of splits
n_splits = 5

# Initialize the TimeSeriesSplit iterator
tscv = TimeSeriesSplit(n_splits=n_splits)

# Train and test the model on each split
scores = []
for train_index, test_index in tscv.split(data):
    # Get the training and testing data for this split
    train_data = data.iloc[train_index]
    test_data = data.iloc[test_index]

    # Separate the target variable from the features
    X_train = train_data.drop(columns=[target_variable])
    y_train = train_data[target_variable]
    X_test = test_data.drop(columns=[target_variable])
    y_test = test_data[target_variable]

    # Train a linear regression model on the training set
    model = LinearRegression()
    model.fit(X_train, y_train)

    # Evaluate the performance of the model on the testing set
    score = model.score(X_test, y_test)
    scores.append(score)

# Calculate the average performance metric over all splits
accuracy = sum(scores) / len(scores)
print('Accuracy:', accuracy)
この例では、Pandasのread_csv()関数を使用してCSVファイルから時系列データを読み込みます。次に、この例では目的変数を 'sales' に設定し、分割数を5に設定します。
次に、scikit-learnのTimeSeriesSplit()関数を使用して、TimeSeriesSplitイテレータを初期化します。イテレータ内の各分割に対して、対応するトレーニングデータとテストデータでモデルをトレーニングおよびテストします。
各分割に対して、目的変数を特徴量から分離し、トレーニングセットで線形回帰モデルをトレーニングします。予測値と実際の値の決定係数(score()メソッドを使用して、モデルのテストセットでのパフォーマンスを評価します。
最後に、スコアを合計して分割数で割ることで、全ての分割の平均パフォーマンスメトリックを計算します。これにより、将来のデータに対するモデルのパフォーマンスの推定値が得られます。時系列交差検証は、過去の観測値に基づいて将来の値を正確に予測することが目的の時系列データのモデルのパフォーマンスを評価するのに特に役立ちます。
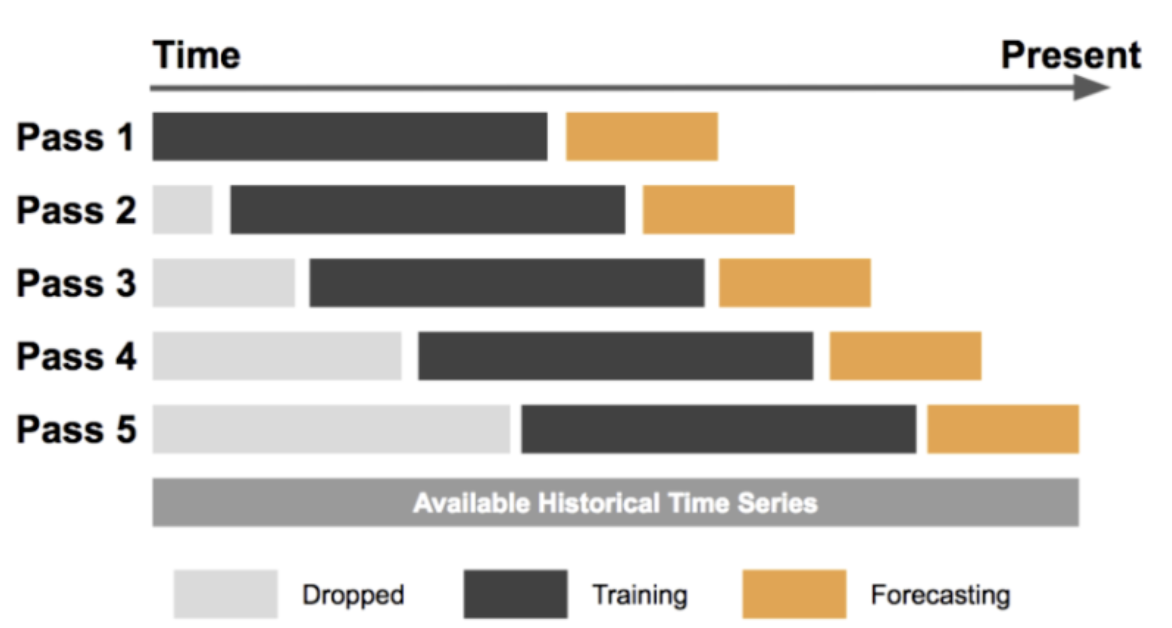
スライディングウィンドウ交差検証
スライディングウィンドウ交差検証は、テストセットが全時系列データ上をスライドする固定サイズのウィンドウで構成される時系列交差検証の一種です。このアプローチは、時間経過とともに進化するデータに基づいて時系列モデルのパフォーマンスを評価するのに役立ちます。
Forecasting at Uber: An Introduction
Here is an example of how to implement sliding window cross validation in Python:
import numpy as np
from sklearn.model_selection import TimeSeriesSplit
from sklearn.linear_model import LinearRegression

# Generate example time series data
data = np.random.rand(100)

# Specify window size
window_size = 10

# Create sliding window iterator
tscv = TimeSeriesSplit(n_splits=len(data)-window_size+1)

# Iterate over sliding windows and train/test the model
for train_index, test_index in tscv.split(data):
    X_train, X_test = data[train_index], data[test_index]
    y_train, y_test = data[train_index+window_size], data[test_index+window_size]

    # Fit model on training data
    model = LinearRegression().fit(X_train.reshape(-1, 1), y_train.reshape(-1, 1))

    # Evaluate model on testing data
    score = model.score(X_test.reshape(-1, 1), y_test.reshape(-1, 1))
    print("R-squared score: ", score)
この例では、長さ100のランダムな時系列データを生成し、ウィンドウサイズを10に設定します。その後、可能なスライドウィンドウの数と同じ数の分割を持つTimeSeriesSplitオブジェクトを作成します。そして、splitメソッドを使用して各スライドウィンドウを反復処理し、データをトレーニングセットとテストセットに分割します。その後、トレーニングデータに対して線形回帰モデルをトレーニングし、R二乗スコアを使用してテストデータの性能を評価します。最後に、各スライドウィンドウのスコアを出力します。
スライドウィンドウ交差検証は、時間経過に伴って進化するデータのパフォーマンスを評価するために有用な技術です。一定のサイズのウィンドウを時系列データ全体にスライドさせることで、異なる時間期間でモデルをトレーニングおよびテストし、その性能の堅牢な推定値を得ることができます。
どの種類の交差検証を選択すべきか
特定の問題に対して最適な交差検証の種類を選択することは、データセットのサイズや複雑さ、トレーニングされるモデルの種類、および分析の具体的な目的など、いくつかの要因に依存します。以下は、実世界のさまざまなシナリオにおいて、どの種類の交差検証を選択するかの例です。
-
サンプル数が限られた小規模データセット
このシナリオでは、利用可能なデータを最大限活用し、モデルの性能の堅牢な推定値を提供するために、一つ抜き交差検証が最適な選択肢になる場合があります。これは、全てのデータポイントが貴重である医学的研究などで有用です。 -
大規模なデータセットと複雑なモデル
このシナリオでは、k分割交差検証が適切な選択肢となります。計算効率と精度のトレードオフをバランスすることができます。例えば、自然言語処理のタスクでは、モデルが大量の特徴量を持っている場合、k分割交差検証を用いることで、データの異なるサブセットにおけるモデルの性能を評価することができます。 -
時系列データ
時系列交差検証は、時間的な構造を考慮する必要がある時系列データに対して最適な選択肢です。例えば、株価を予測する場合には、時系列交差検証を使用して、トレーニングデータと時間的に独立したデータでモデルを評価することが重要です。 -
不均衡なデータセット
不均衡なデータセットにおいては、層化交差検証が適切な選択肢となります。層化交差検証は、正例と負例の両方の代表的なサンプルが各フォールドに含まれるようにすることができます。例えば、医療診断においては、疾患が稀であっても、陽性のケースを正しく識別することが重要です。そのため、層化交差検証を行うことで、モデルが多数派クラスに偏らないようにすることが重要です。
まとめると、最適な交差検証のタイプを選択するには、データセットの特性と分析の目的を考慮する必要があります。データのサイズ、複雑さ、性質を考慮し、適切な交差検証のタイプを選択することで、信頼性の高いモデルの性能評価を行い、一般的な落とし穴を回避することができます。
参考


Ryusei Kakujo


Weave the future of cities through data
Transportation modeling/ Urban planning/ Machine learning/ Computer science/ GIS