Apa itu regresi Gamma
Regresi Gamma adalah GLM yang digunakan untuk mengekspresikan kejadian yang diamati dalam hal distribusi gamma. Fungsi link dari distribusi gamma sering digunakan dengan fungsi log link.
Membangun model regresi gamma
Mari kita benar-benar membangun model regresi gamma. Dalam hal ini, kita akan menggunakan Boston Housing Dataset dari scikit-learn.
import pandas as pd
import numpy as np
from sklearn.datasets import load_boston

boston = load_boston()
X = boston.data
y = boston.target

df = pd.DataFrame(X, columns = boston.feature_names).assign(MEDV=np.array(y))
df = df[['RM', 'MEDV']]
display(df.head())
| RM | MEDV | |
|---|---|---|
| 0 | 6.575 | 24.0 |
| 1 | 6.421 | 21.6 |
| 2 | 7.185 | 34.7 |
| 3 | 6.998 | 33.4 |
| 4 | 7.147 | 36.2 |
Arti dari setiap kolom adalah sebagai berikut
- MEDV: Nilai median unit rumah yang ditempati pemilik sebesar $1000
- RM: Rata-rata jumlah kamar per hunian
Investigasi data
Mari kita periksa statistik deskriptif.
df.describe()
| RM | MEDV | |
|---|---|---|
| count | 506.000000 | 506.000000 |
| mean | 6.284634 | 22.532806 |
| std | 0.702617 | 9.197104 |
| min | 3.561000 | 5.000000 |
| 25% | 5.885500 | 17.025000 |
| 50% | 6.208500 | 21.200000 |
| 75% | 6.623500 | 25.000000 |
| max | 8.780000 | 50.000000 |
Menampilkan plot pencar.
import matplotlib.pyplot as plt
import seaborn as sns
%matplotlib inline

plt.figure(figsize=(10,5))
sns.set(rc={'figure.figsize':(10,5)})

sns.scatterplot(x='RM', y='MEDV', data=df)

Pembuatan model
Asumsikan bahwa MEDV mengikuti distribusi gamma. Dalam hal ini, kita akan membangun dua model regresi gamma berikut dengan MEDV rata-rata sebagai
| Model | Fungsi log link |
|---|---|
| Model 1 | |
| Model 2 |
Estimasi parameter (Model 1)
import statsmodels.formula.api as smf
import statsmodels.api as sm

fit = smf.glm(formula='MEDV ~ RM', data=df, family=sm.families.Gamma(link=sm.families.links.log)).fit()
fit.summary()
Hasil berikut ini diperoleh.
| GLM Results | |||
|---|---|---|---|
| Dep. Variable | MEDV | No. Observations | 506 |
| Model | GLM | Df Residuals | 504 |
| Model Family | Gamma | Df Model | 1 |
| Link Function | log | Scale: | 0.096893 |
| Method | IRLS | Log-Likelihood | -1658.9 |
| Date | Wed, 28 Dec 2022 | Deviance: | 47.467 |
| Time | 02:50:46 | Pearson chi2 | 48.8 |
| No. Iterations | 15 | Covariance Type | nonrobust |
| coef | std err | z | P>|z| | [0.025 | 0.975] | |
|---|---|---|---|---|---|---|
| Intercept | 0.9379 | 0.125 | 7.524 | 0.000 | 0.694 | 1.182 |
| RM | 0.3411 | 0.020 | 17.300 | 0.000 | 0.302 | 0.380 |
Mari kita turunkan AIC.
fit.aic

3321.8747164073784
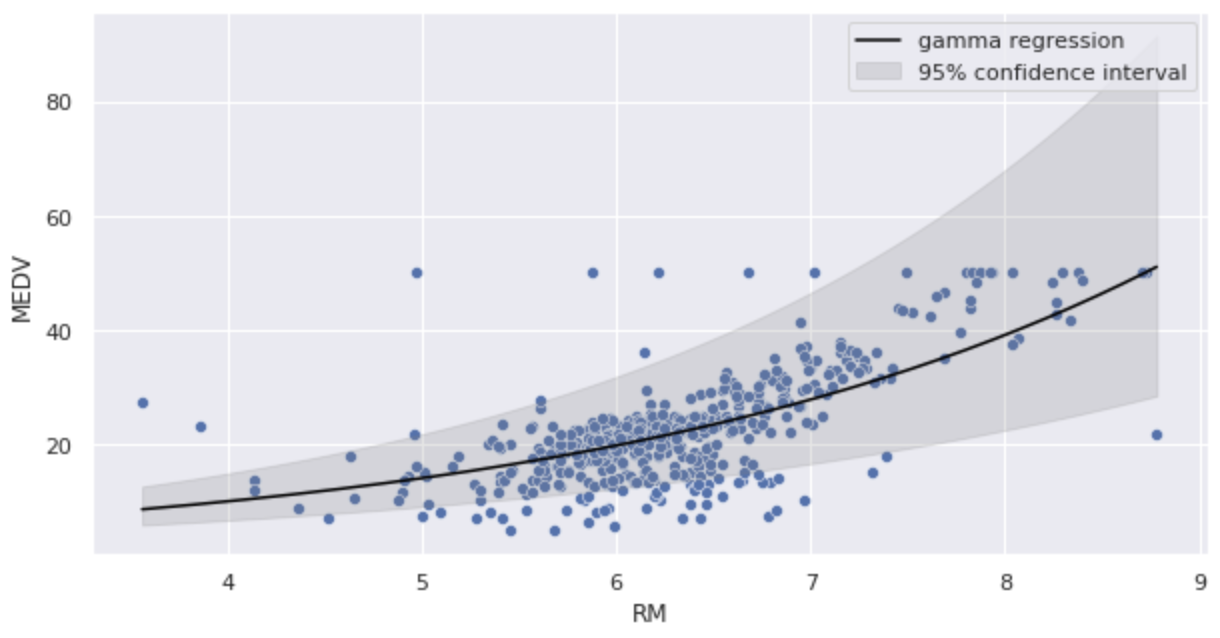
Substitusikan estimasi parameter ke dalam model regresi gamma dan ilustrasikan.
import numpy as np
import math

sns.scatterplot(x='RM', y='MEDV', data=df)
x = np.arange(df.RM.min(), df.RM.max() + 0.01, 0.01)
y = np.exp(fit.params['Intercept'] + fit.params['RM'] * x)
y_lower = np.exp((fit.conf_int().loc['Intercept'][0]) + fit.conf_int().loc['RM'][0] * x)
y_upper = np.exp((fit.conf_int().loc['Intercept'][1]) + fit.conf_int().loc['RM'][1] * x)
plt.plot(x, y, color='black', label='gamma regression')
plt.fill_between(x, y_lower, y_upper, color='grey', alpha=0.2, label='95% confidence interval')
plt.legend()
plt.show()

Karena ini adalah fungsi log link, kita dapat melihat bahwa kurva diprediksi menjadi kurva bahu kanan.
Estimasi parameter (Model 2)
Parameter glm formula ditulis sebagai formula='MEDV ~ np.log(RM)'.
import statsmodels.formula.api as smf
import statsmodels.api as sm

fit = smf.glm(formula='MEDV ~ np.log(RM)', data=df, family=sm.families.Gamma(link=sm.families.links.log)).fit()
fit.summary()
| GLM Results | |||
|---|---|---|---|
| Dep. Variable | MEDV | No. Observations | 506 |
| Model | GLM | Df Residuals | 504 |
| Model Family | Gamma | Df Model | 1 |
| Link Function | log | Scale: | 0.10838 |
| Method | IRLS | Log-Likelihood | -1675.8 |
| Date | Wed, 28 Dec 2022 | Deviance: | 50.505 |
| Time | 02:50:46 | Pearson chi2 | 54.6 |
| No. Iterations | 22 | Covariance Type | nonrobust |
| coef | std err | z | P>|z| | [0.025 | 0.975] | |
|---|---|---|---|---|---|---|
| Intercept | -0.5489 | 0.239 | -2.293 | 0.022 | -1.018 | -0.080 |
| np.log(RM) | 1.9834 | 0.130 | 15.208 | 0.000 | 1.728 | 2.239 |
Mari kita turunkan AIC.
fit.aic

3355.6367279321394
AIC lebih besar daripada Model 1.
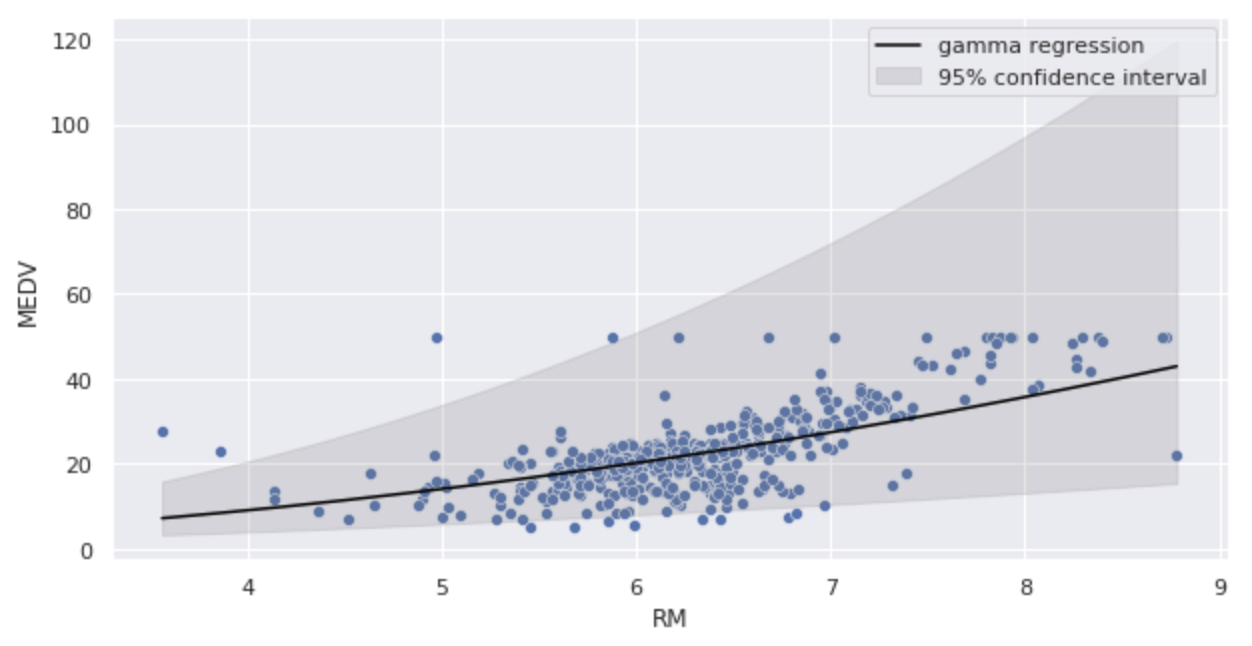
Mari kita substitusikan estimasi parameter ke dalam model regresi gamma dan ilustrasikan.
import numpy as np
import math

sns.scatterplot(x='RM', y='MEDV', data=df)
x = np.arange(df.RM.min(), df.RM.max() + 0.01, 0.01)
y = np.exp(fit.params['Intercept'] + fit.params['np.log(RM)'] * np.log(x))
y_lower = np.exp((fit.conf_int().loc['Intercept'][0]) + fit.conf_int().loc['np.log(RM)'][0] * np.log(x))
y_upper = np.exp((fit.conf_int().loc['Intercept'][1]) + fit.conf_int().loc['np.log(RM)'][1] * np.log(x))
plt.plot(x, y, color='black', label='gamma regression')
plt.fill_between(x, y_lower, y_upper, color='grey', alpha=0.2, label='95% confidence interval')
plt.legend()
plt.show()

Kemiringan kurva lebih bertahap daripada Model 1.