What is geometric distribution
A geometric distribution is a probability distribution that follows a probability
- The number of times a coin is tossed until the front comes up
- Number of shots a basketball player with a 30% three-point success rate takes before making a three-pointer
When the random variable
The geometric distribution is sometimes denoted as
For

For example, the probability that the third toss of a coin will produce a face for the first time can be determined as follows:
We found that the probability of the table appearing for the first time on the third throw is 12.5%.
Relationship to binomial distribution
The binomial distribution is a probability distribution that follows the number of times an event occurs when
In other words, the binomial distribution considers the same event in terms of "number of times" while the geometric distribution considers it in terms of "time/interval.
We can also say that the geometric distribution is the value of
Expected value and variance of geometric distribution
When a random variable
Memoryless of geometric distribution
If the random variable
The above equation implies that the time until the occurrence of a future event does not depend on the existence of that past event. For example, if a coin is tossed three times, and the first two tosses are all true, the result does not affect the probability of the third toss being true at all. This property is called memoryless. The geometric distribution is the only discrete distribution with memoryless.
Python Code
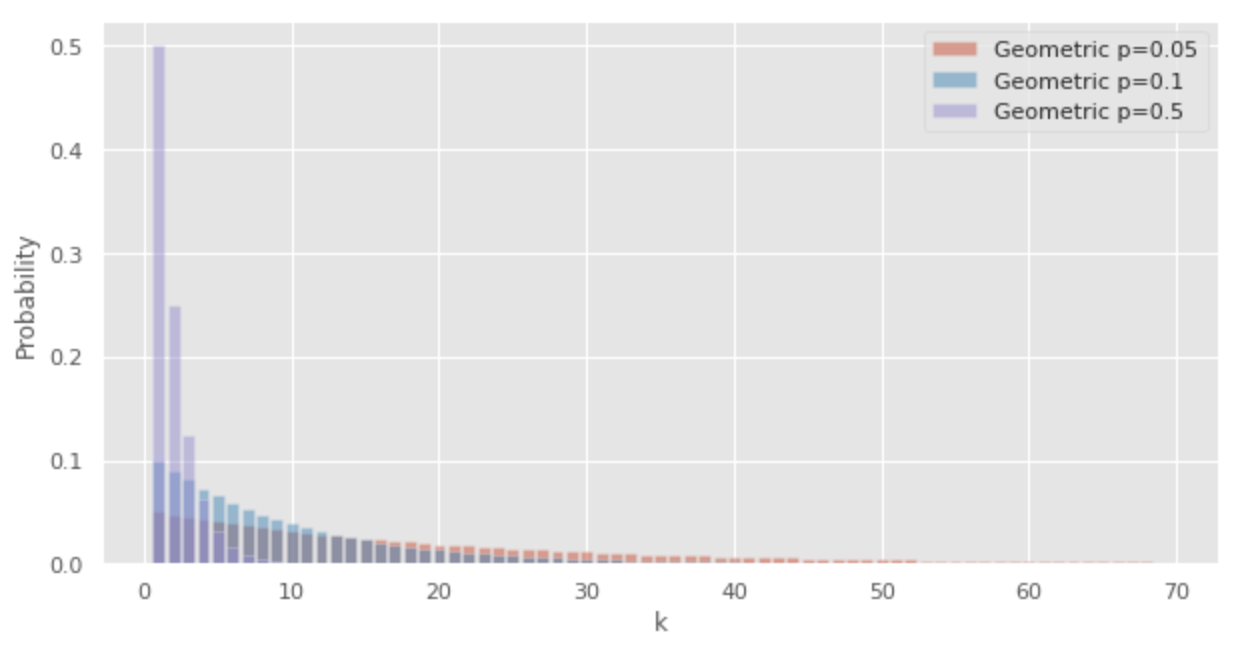
The following Python code can be used to draw geometric distributions.
import numpy as np
from scipy.stats import geom
import matplotlib.pyplot as plt

x =  np.arange(1, 70, 1)

# probability of the geometric distribution
y005= [geom.pmf(i, 0.05) for i in x]
y01= [geom.pmf(i, 0.1) for i in x]
y05= [geom.pmf(i, 0.5) for i in x]

# draw graph
plt.style.use('ggplot')
fig, ax = plt.subplots(facecolor="w", figsize=(10, 5))

ax.bar(x,y005,alpha=0.5, label="Geometric p=0.05")
ax.bar(x,y01,alpha=0.5, label="Geometric p=0.1")
ax.bar(x,y05,alpha=0.5, label="Geometric p=0.5")

ax.legend()
ax.set_xlabel("k")
ax.set_ylabel("Probability")
plt.show()
