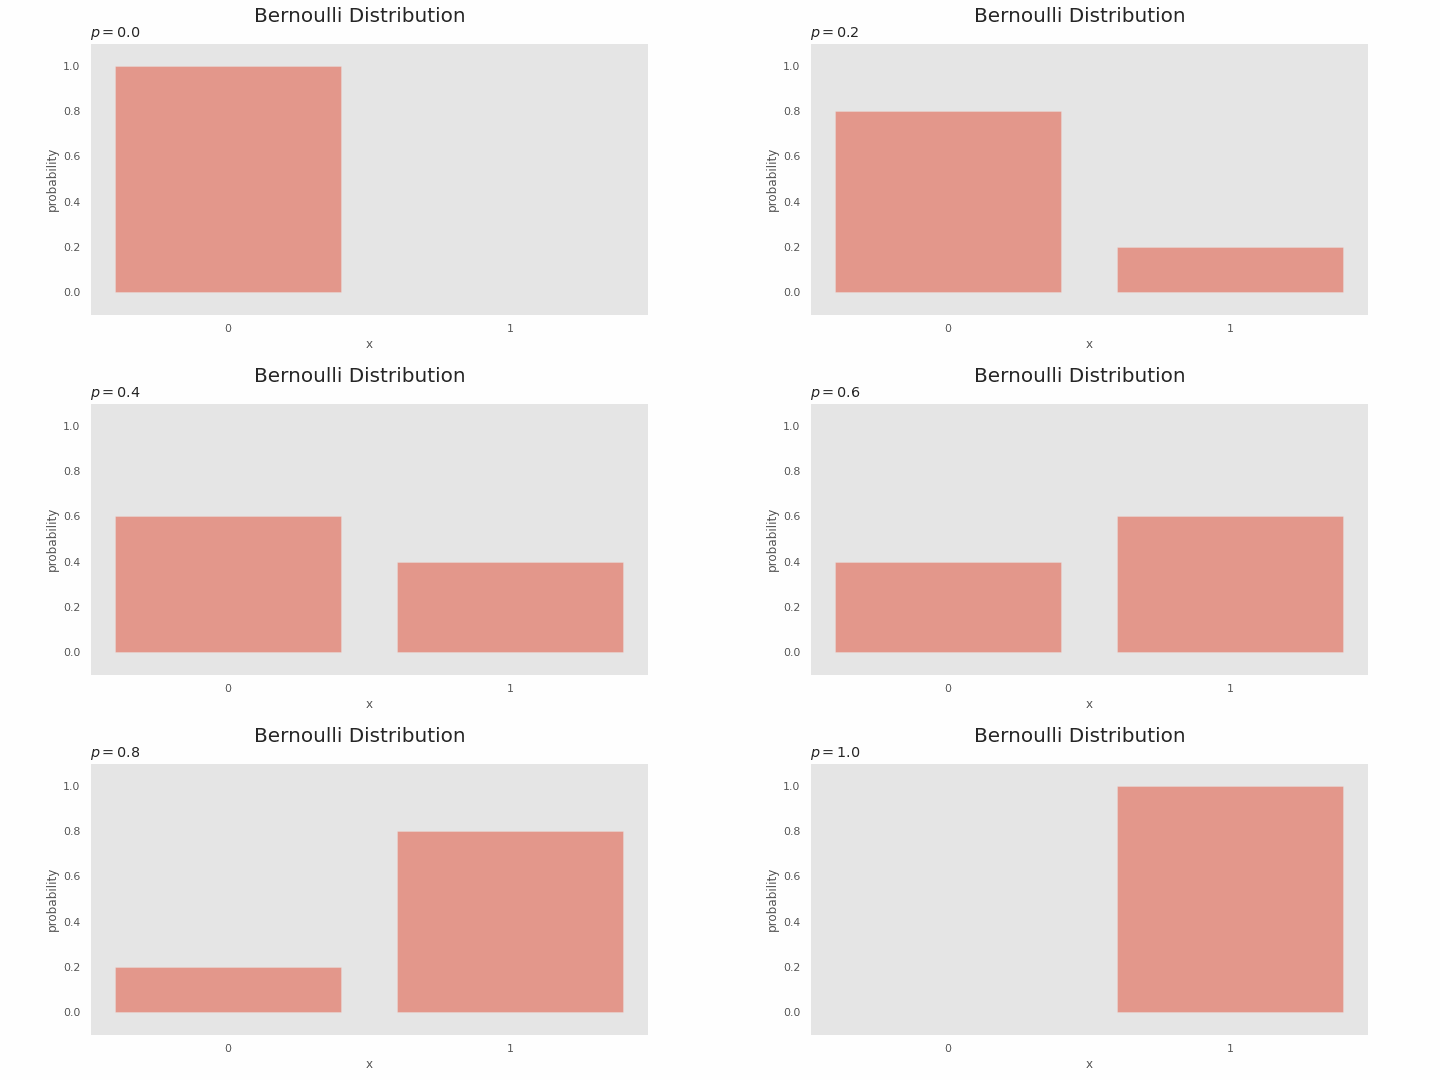
What is the Bernoulli distribution
A Bernoulli trial is a trial in which only two events are obtained from a given trial, such as whether a coin toss turns up heads or tails, or whether a new drug is effective or not, etc. The Bernoulli distribution is a probability distribution obtained from a single Bernoulli trial.
In a Bernoulli trial, one of the two events is considered "success" and the probability variable
| Event | 1 | 0 |
|---|---|---|
| Probability |
The Bernoulli distribution depends on

Relationship with binomial distribution
In Binomial distribution, when
Dice example
Let us consider the distribution of the number of times a dice roll yields 1.
First, let's consider the events. There are the following two patterns of events.
- A 1 is rolled.
- No 1 is appear.
Since the event is a two-choice event, i.e., either the event occurs or it does not occur, and there is only one trial, the distribution of the probability of this event occurring is the Bernoulli distribution.
Next, we consider the probability of the event occurring: the probability of the eye 1 occurring and the probability of the eye 1 not occurring are respectively as follows.
| Event | Eye 1 appears | Eye 1 does not appear |
|---|---|---|
| Probability |
Python Code
Here is the code to create a gif of the Bernoulli distribution.
import numpy as np
import matplotlib
import matplotlib.pyplot as plt
from matplotlib import animation, rc
from matplotlib.animation import FuncAnimation
from IPython.display import HTML, Image # For GIF

rc('animation', html='html5')
np.random.seed(5)

# Set up formatting for the movie files
Writer = animation.writers['ffmpeg']
writer = Writer(fps=15, metadata=dict(artist='Me'), bitrate=1800)

prob_vals = np.arange(start=0.0, stop=1.01, step=0.05)

plt.style.use('ggplot')
fig = plt.figure(figsize=(10, 5))

def update(i):
    # initialize the graph of the previous frame
    plt.cla()

    p = prob_vals[i]

    # draw bernoulli distribution
    plt.bar([0.0, 1.0], [1.0 - p, p], alpha=0.5) # bar graph
    plt.xlabel('x')
    plt.ylabel('probability')
    plt.suptitle('Bernoulli Distribution', fontsize=20)
    plt.title('$p=' + str(np.round(p, 2)) + '$', loc='left')
    plt.xticks(ticks=[0, 1]) # x axis ticks
    plt.grid()
    plt.ylim(-0.1, 1.1)

anime_prob = FuncAnimation(fig, update, frames=len(prob_vals), interval=1000)

anime_prob.save('bernoulli_dist.gif', writer='pillow', fps=1)
Image(url='bernoulli_dist.gif')
