


What is the categorical distribution
A categorical distribution is a probability distribution that the random variable
The categorical distribution is a probability distribution that extends the Bernoulli distribution to the
The probability of the categorical distribution is expressed by the following equation:
Categorical distribution is sometimes denoted as
Expected value and variance of categorical distribution
The expected value and variance of the categorical distribution are respectively:
Check categorical distributions with Python
Let's check the categorical distribution with Python.
First, consider the example of dice (
import numpy as np
import matplotlib.pyplot as plt

plt.style.use('ggplot')
fig, ax = plt.subplots(facecolor="w", figsize=(10, 5))

p = [1/6, 1/6, 1/6, 1/6, 1/6, 1/6]

data = np.random.choice([1,2,3,4,5,6], p=p, size=6000)
plt.hist(data, bins = [0.5 + v for v in range(len(p) + 1)], alpha=0.5)
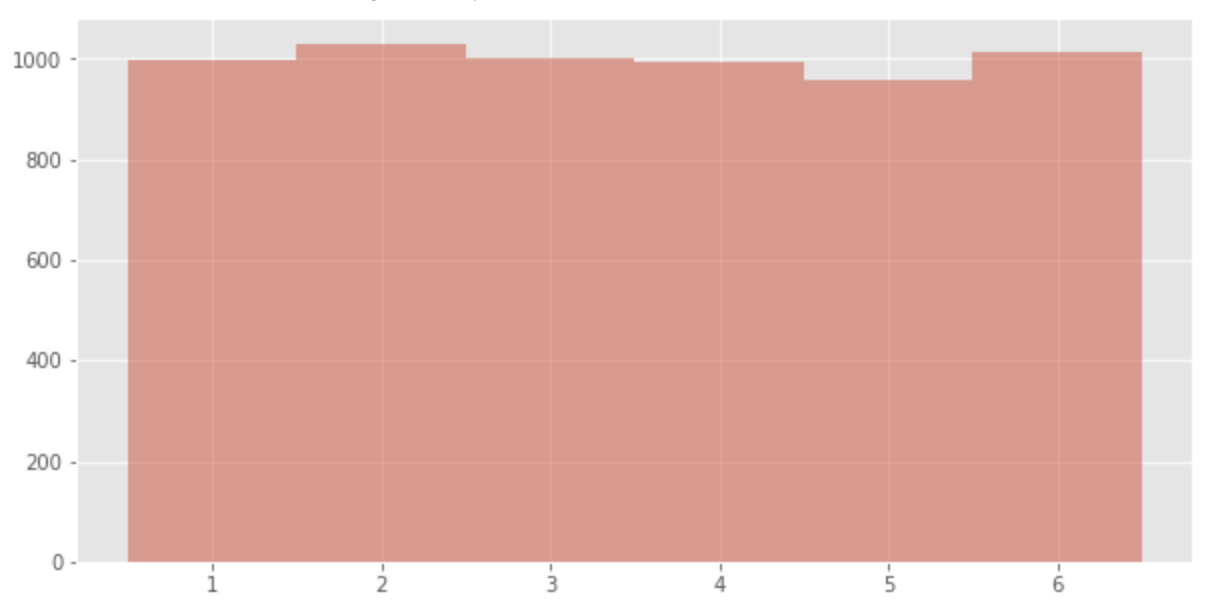
We can see that the number of occurrences of any eye is about 1000.
Next, suppose we have
import numpy as np
import matplotlib.pyplot as plt
from matplotlib.ticker import MaxNLocator

plt.style.use('ggplot')
fig, ax = plt.subplots(facecolor="w", figsize=(10, 5))
ax.xaxis.set_major_locator(MaxNLocator(integer=True))

p = [2/10, 1/10, 5/10, 2/10]

data = np.random.choice([1,2,3,4], p=p, size=10000)
plt.hist(data, bins = [0.5 + v for v in range(len(p) + 1)], alpha=0.5)
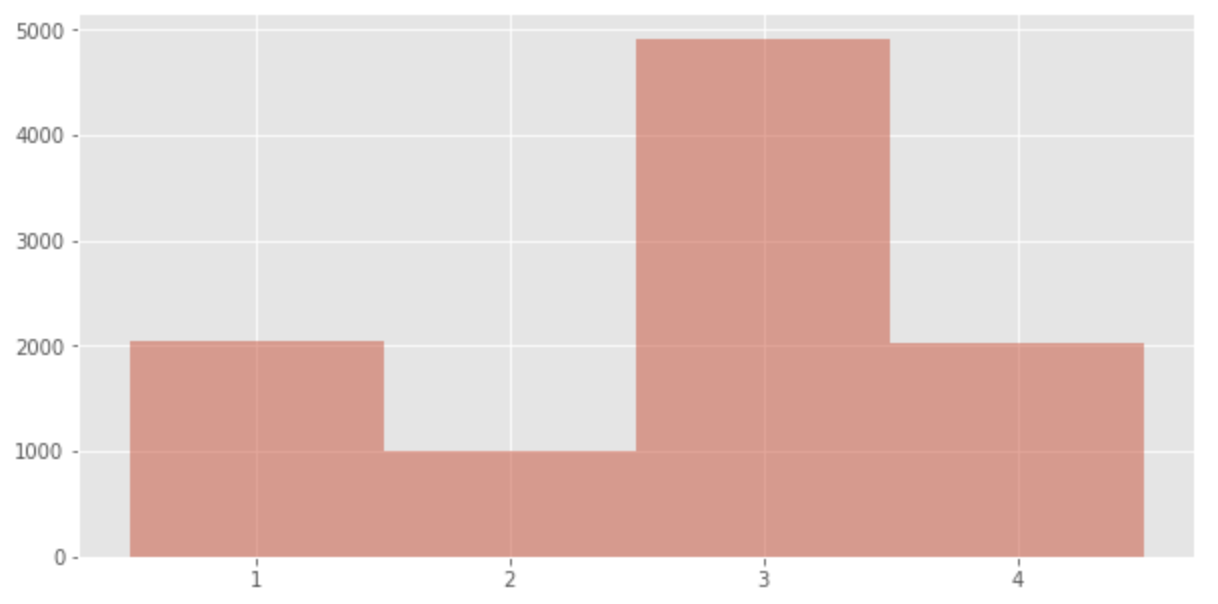
We can see that the distribution is in line with the probability.


Ryusei Kakujo


Weave the future of cities through data
Transportation modeling/ Urban planning/ Machine learning/ Computer science/ GIS