


What is Poisson distribution
Poisson distribution is a probability distribution that is followed by the probability of an event occurring
- Probability of 10 people per hour visiting a restaurant that serves 1 person per hour
- Probability that an intersection with an average of 3 traffic accidents per day will have no traffic accidents today
When the random variable
From the above equation, we see that the Poisson distribution depends only on
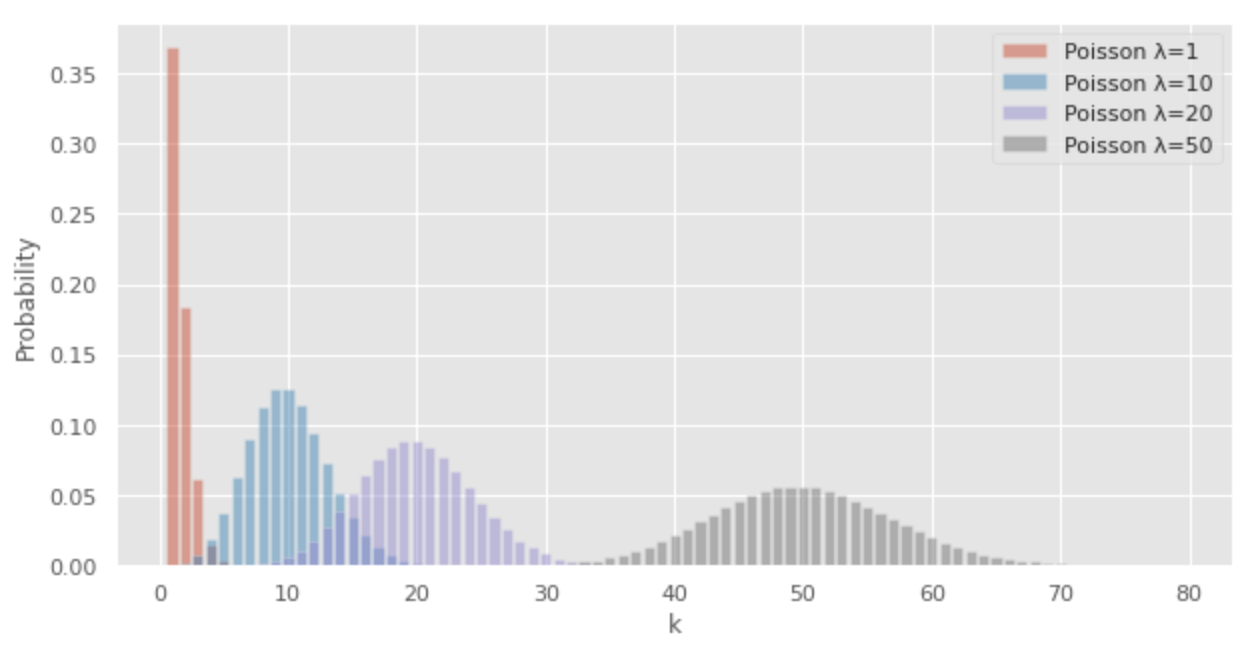
The larger
As an example of probability calculation for the Poisson distribution, let us find the probability of 10 customers per hour at a restaurant that serves an average of 5 customers per hour. In this case,
The probability of 10 visitors per hour was 1.8%.
Relationship with binomial distribution
The binomial distribution is a probability distribution that the number of times
From the above equation, to assume that an event follows a Poisson distribution, we need to deal with small values of probability
The probability of a traffic accident occurring in one second is infinitesimally small. In this way, time can be infinitely small and the probability
Expected value and variance of Poisson distribution
The expectation and variance of the Poisson distribution are both
Reproductive property of the Poisson distribution
Suppose that the random variables
In this case, from the reproductive property of the Poisson distribution,
Python Code
The following Python code can be used to draw a Poisson distribution.
import numpy as np
from scipy.stats import poisson
import matplotlib.pyplot as plt

x =  np.arange(1, 80, 1)

# probability of the poisson distribution
y1= [poisson.pmf(i, 1) for i in x]
y10= [poisson.pmf(i, 10) for i in x]
y20= [poisson.pmf(i, 20) for i in x]
y50= [poisson.pmf(i, 50) for i in x]

# draw graph
plt.style.use('ggplot')
fig, ax = plt.subplots(facecolor="w", figsize=(10, 5))
# plt.grid()

ax.bar(x,y1,alpha=0.5, label="Poisson λ=1")
ax.bar(x,y10,alpha=0.5, label="Poisson λ=10")
ax.bar(x,y20,alpha=0.5, label="Poisson λ=20")
ax.bar(x,y50,alpha=0.5, label="Poisson λ=50")

ax.legend()
ax.set_xlabel("k")
ax.set_ylabel("Probability")
plt.show()


Ryusei Kakujo


Weave the future of cities through data
Transportation modeling/ Urban planning/ Machine learning/ Computer science/ GIS