正規分布における68-95-99.7則
正規分布は、統計学や確率論の分野において基本的な概念の一つであり、社会科学から自然科学や工学まで、様々な分野で多数の応用があります。正規分布の重要な特徴の一つが、経験則(Empirical Rule)としても知られる「68-95-99.7則」です。
68-95-99.7則の理解
経験則は、正規分布曲線の性質に基づいています。正規分布では、平均値、中央値、モードが一致し、曲線はその平均値(
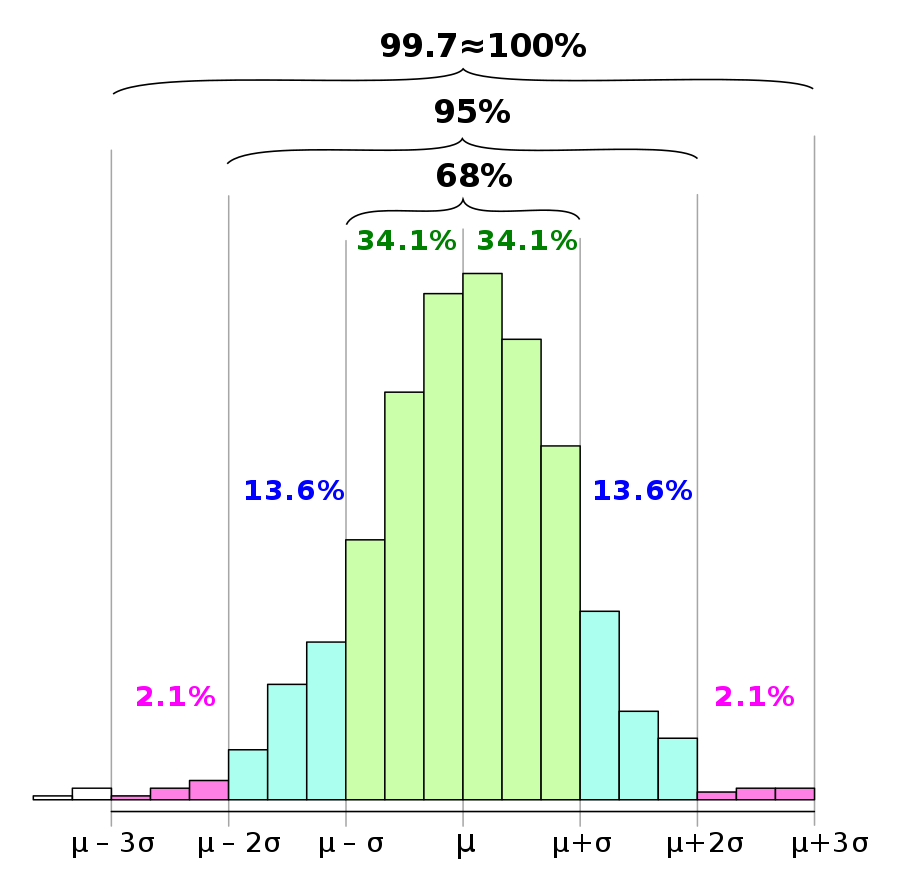
68-95-99.7則は、正規分布において次のように定義されます。
- 約68%のデータが平均値から標準偏差の範囲内(
\mu\pm\sigma - 約95%のデータが平均値から標準偏差の2倍の範囲内(
\mu\pm2\sigma - 約99.7%のデータが平均値から標準偏差の3倍の範囲内(
\mu\pm3\sigma
これらの割合は、正規分布の数学的性質から導かれ、この分布に従うデータの解析において実用的なツールとして機能します。
68-95-99.7則の視覚化
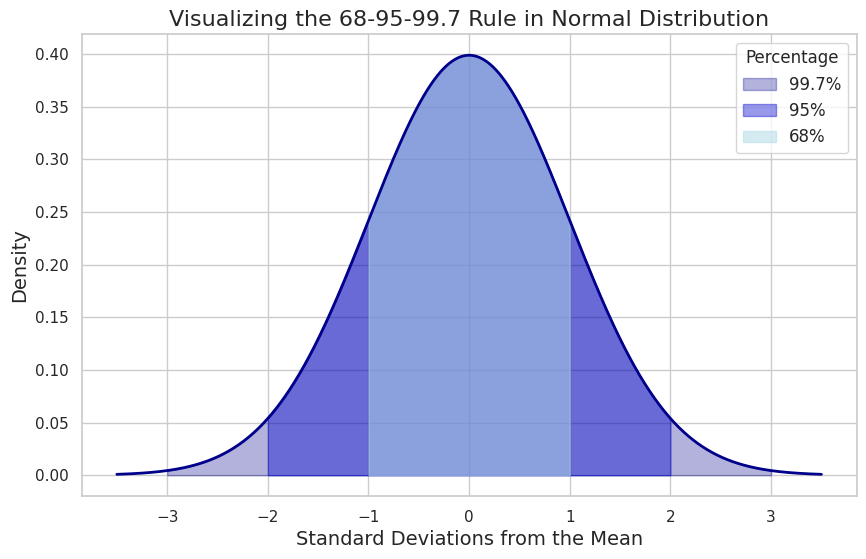
この章では、Pythonを使用して68-95-99.7則を視覚化する方法を示します。正規分布データセットを生成し、経験則の割合を強調するプロットを作成します。
以下がコードです。
python
import numpy as np
import matplotlib.pyplot as plt
import seaborn as sns
from scipy.stats import norm

# Set the Seaborn style
sns.set(style="whitegrid")

# Parameters for the normal distribution
mean = 0
std_dev = 1
sample_size = 1000

# Generate the dataset
data = np.random.normal(mean, std_dev, sample_size)

plt.figure(figsize=(10, 6))

# Calculate the x values within each standard deviation range
x = np.linspace(mean - 3.5 * std_dev, mean + 3.5 * std_dev, 1000)
x1 = np.linspace(mean - std_dev, mean + std_dev, 1000)
x2 = np.linspace(mean - 2 * std_dev, mean + 2 * std_dev, 1000)
x3 = np.linspace(mean - 3 * std_dev, mean + 3 * std_dev, 1000)

# Get the corresponding y values for the normal distribution
y = norm.pdf(x, mean, std_dev)

# Plot the areas under the curve
plt.fill_between(x3, 0, norm.pdf(x3, mean, std_dev), color='darkblue', alpha=0.3, label='99.7%')
plt.fill_between(x2, 0, norm.pdf(x2, mean, std_dev), color='mediumblue', alpha=0.4, label='95%')
plt.fill_between(x1, 0, norm.pdf(x1, mean, std_dev), color='lightblue', alpha=0.5, label='68%')

# Customize the appearance
plt.plot(x, y, color='darkblue', linewidth=2)
plt.title('Visualizing the 68-95-99.7 Rule in Normal Distribution', fontsize=16)
plt.xlabel('Standard Deviations from the Mean', fontsize=14)
plt.ylabel('Density', fontsize=14)
plt.legend(title='Percentage', fontsize=12, title_fontsize=12)

# Display the plot
plt.show()

このコードは、正規分布の文脈で68-95-99.7則を示すプロットを生成します。影のある領域は、経験則によって指定された平均値から1、2、3標準偏差の範囲内にあるデータの割合を表します。
AlloyDB
Amazon Cognito
Amazon EC2
Amazon ECS
Amazon QuickSight
Amazon RDS
Amazon Redshift
Amazon S3
API
Autonomous Vehicle
AWS
AWS API Gateway
AWS Chalice
AWS Control Tower
AWS IAM
AWS Lambda
AWS VPC
BERT
BigQuery
Causal Inference
ChatGPT
Chrome Extension
CircleCI
Classification
Cloud Functions
Cloud IAM
Cloud Run
Cloud Storage
Clustering
CSS
Data Engineering
Data Modeling
Database
dbt
Decision Tree
Deep Learning
Descriptive Statistics
Differential Equation
Dimensionality Reduction
Discrete Choice Model
Docker
Economics
FastAPI
Firebase
GIS
git
GitHub
GitHub Actions
Google
Google Cloud
Google Search Console
Hugging Face
Hypothesis Testing
Inferential Statistics
Interval Estimation
JavaScript
Jinja
Kedro
Kubernetes
LightGBM
Linux
LLM
Mac
Machine Learning
Macroeconomics
Marketing
Mathematical Model
Meltano
MLflow
MLOps
MySQL
NextJS
NLP
Nodejs
NoSQL
ONNX
OpenAI
Optimization Problem
Optuna
Pandas
Pinecone
PostGIS
PostgreSQL
Probability Distribution
Product
Project
Psychology
Python
PyTorch
QGIS
R
ReactJS
Regression
Rideshare
SEO
Singer
sklearn
Slack
Snowflake
Software Development
SQL
Statistical Model
Statistics
Streamlit
Tabular
Tailwind CSS
TensorFlow
Terraform
Transportation
TypeScript
Urban Planning
Vector Database
Vertex AI
VSCode
XGBoost
