Streamlitとは
Streamlitとは、データサイエンスや機械学習のアプリケーションの開発を簡単に行うことができるPythonフレームワークです。HTMLやCSSなどの知識を要することなくデータの可視化が可能です。
インストール
次のコマンドでStreamlitをインストールします。
bash
$ pip install streamlit
Streamlitの実行
app.pyファイルを作成します。
app.py
import streamlit as st

st.title("hello world")
そしてstreamlit run app.pyを実行します。
bash
$ streamlit run app.py
You can now view your Streamlit app in your browser.

Local URL: http://localhost:8555
http://localhost:8555にアクセスするとStreamlitアプリケーションを確認することができます。

テキスト
Streamlitでは、Markdownなどを使用してテキストを表示することができます。
app.py
import streamlit as st

st.title("title") # Title
st.header("header") # Header
st.write("write") # Display
st.markdown("# markdown") # markdown
st.text("text") # Text

ウィジェット
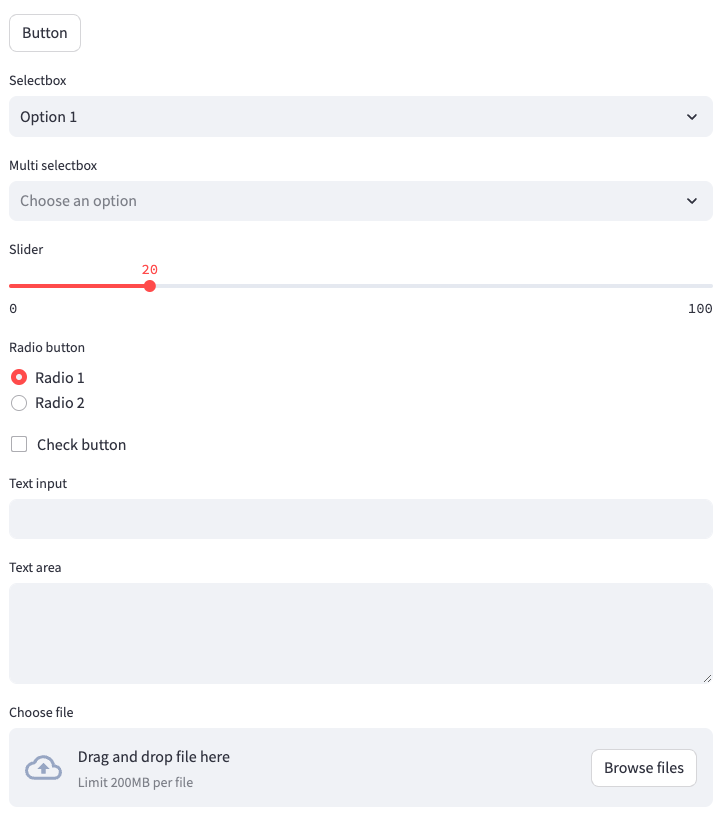
Streamlitには、スライダー、チェックボックス、ラジオボタンなどのインタラクティブなウィジェットが用意されています。
app.py
import streamlit as st

st.button("Button")  # Button
st.selectbox("Selectbox", ("Option 1", "Option 2"))  # Select box
st.multiselect("Multi selectbox", ("Option 1", "Option 2"))  # Multi select box
st.slider("Slider", 0, 100, 20)  # Slider
st.radio("Radio button", ("Radio 1", "Radio 2"))  # Radio button
st.checkbox("Check button")  # Checkbox
st.text_input("Text input")  # Text input (one line)
st.text_area("Text area")  # Text input (multiple line)
st.file_uploader("Choose file")  # File upload
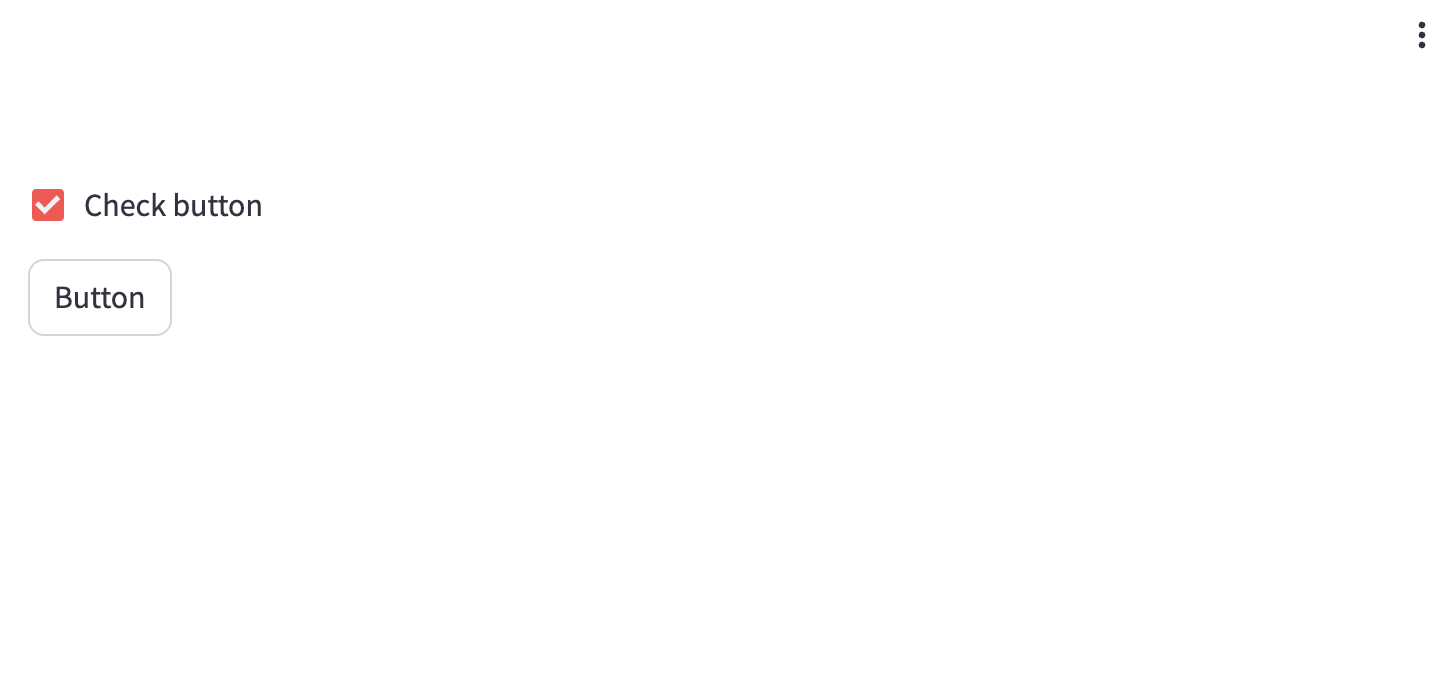
ウィジェットの戻り値を変数に入れることで表示制御も行うことができます。
app.py
import streamlit as st

checked = st.checkbox("Check button")

if checked:
    st.button("Button")

サイドバー
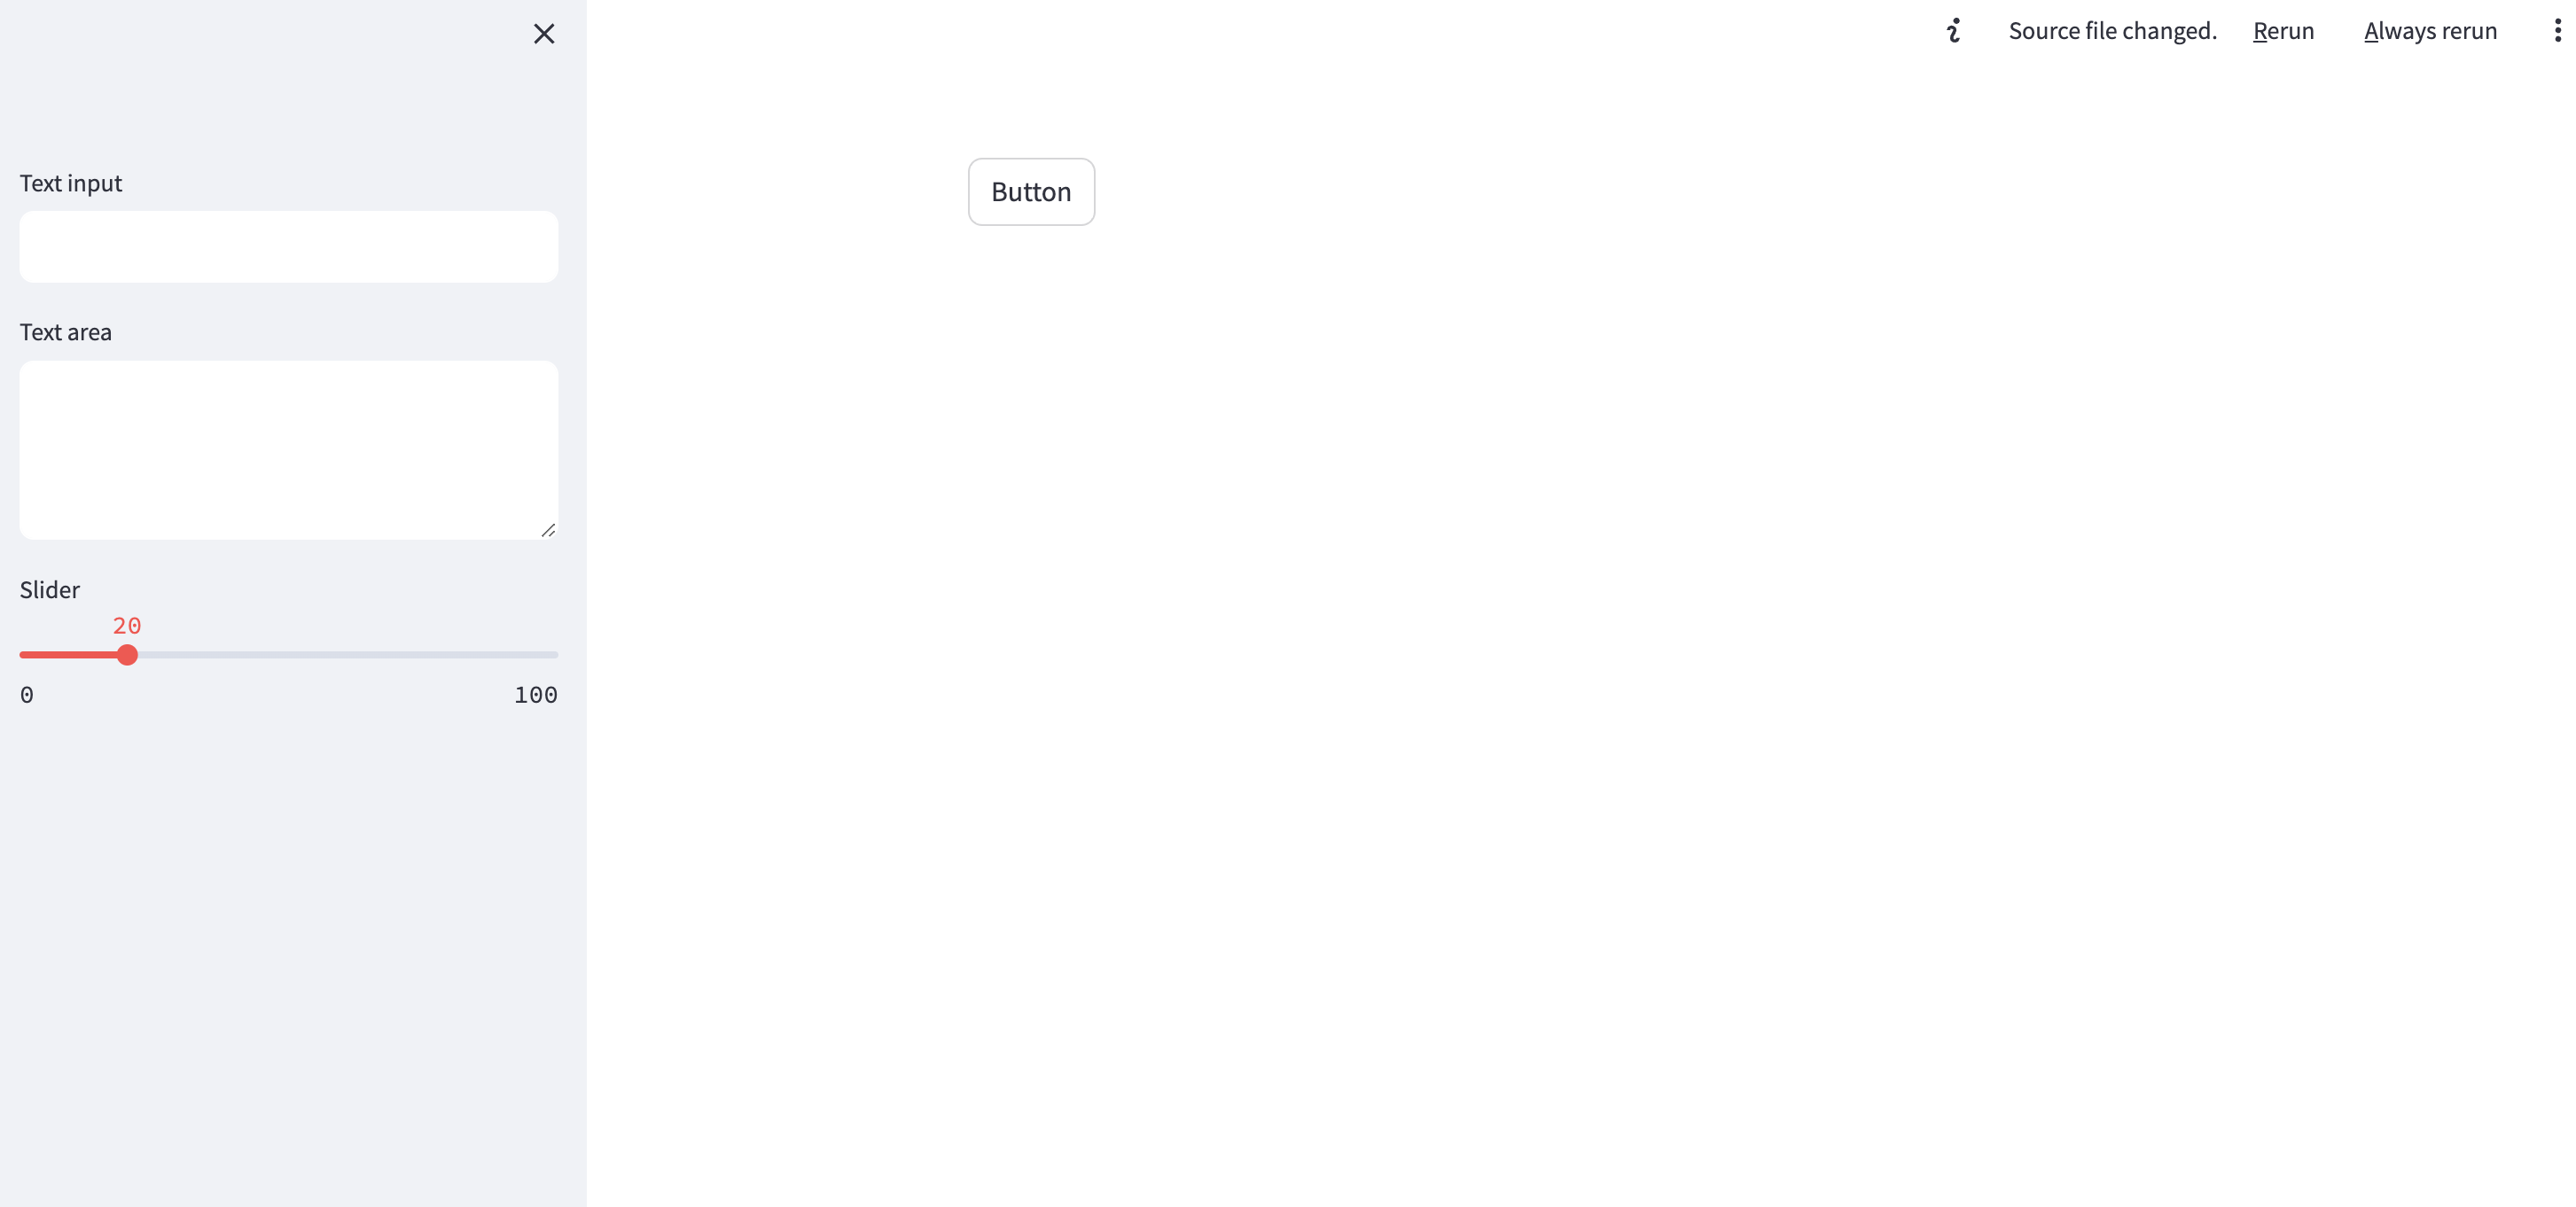
Streamlitでは、主要なアプリケーションのエリアとは別に、サイドバーを使用してウィジェットを表示することができます。
app.py
import streamlit as st

st.button("Button")

st.sidebar.text_input("Text input")
st.sidebar.text_area("Text area")
st.sidebar.slider("Slider", 0, 100, 20)
テーブル
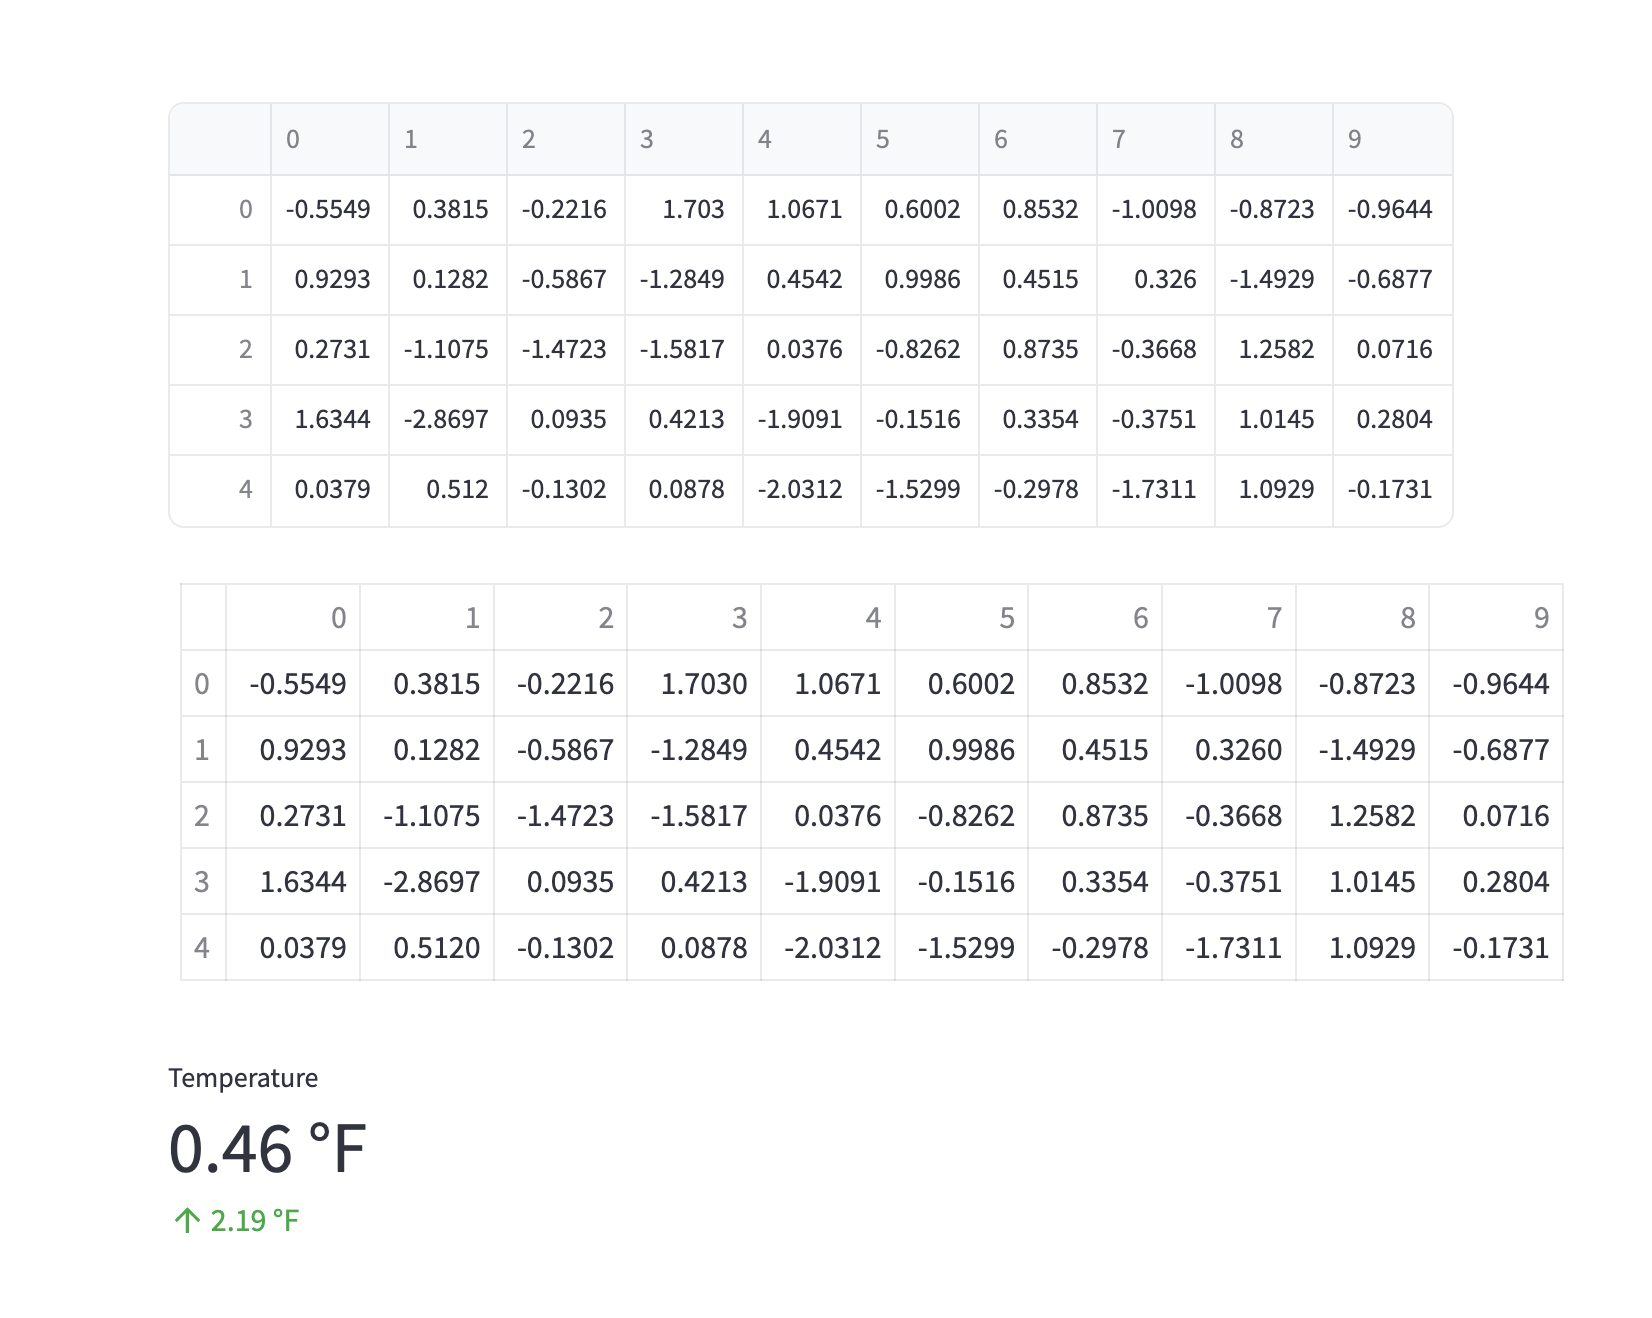
StreamlitはPandasのDataFrameを直接表示する機能を持っています。これにより、データを整形されたテーブル形式で表示できます。また、大量のデータに対しても高速に動作します。
app.py
import numpy as np
import pandas as pd

import streamlit as st

df = pd.DataFrame(np.random.randn(5, 10))
st.dataframe(df)  # Pandas dataframe
st.table(df)  # Table
st.metric(
    label="Temperature",
    value=f"{round(df[0].mean(), 2)} °F",
    delta=f"{round(df[0].max() - df[0].min(), 2)} °F",
)  # Metrics
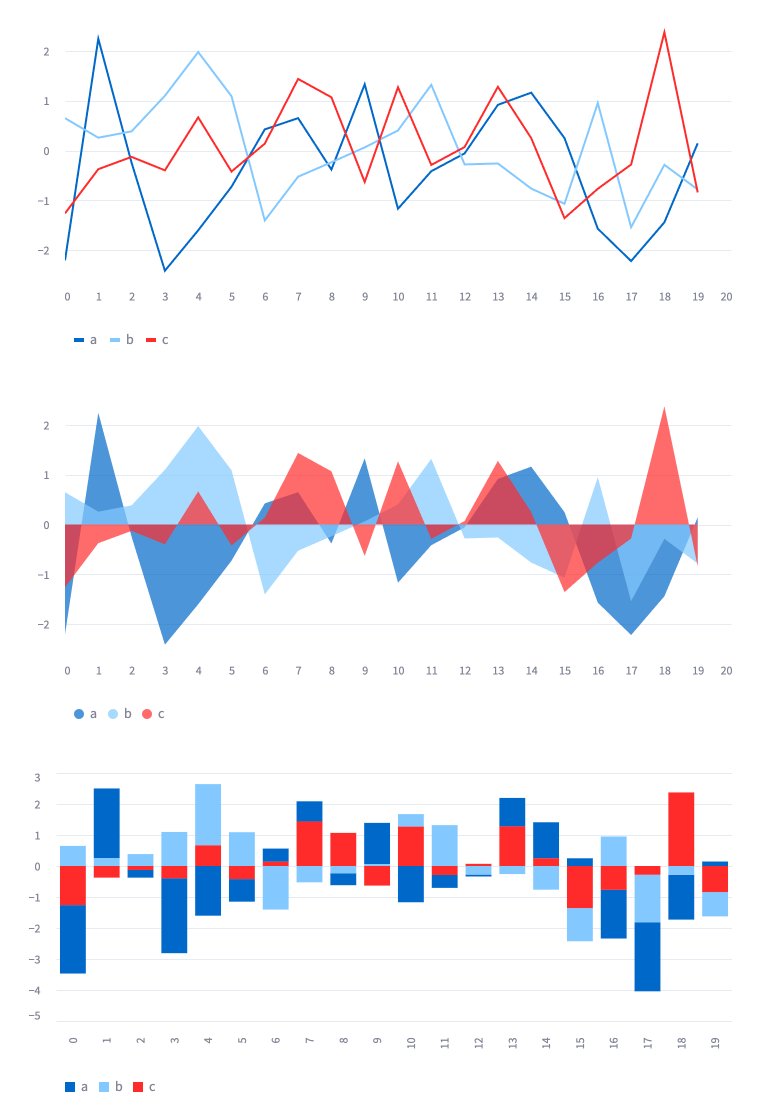
グラフ
Streamlitを使って、データをグラフ化して視覚的に理解することができます。
app.py
import streamlit as st
import pandas as pd
import numpy as np

dataframe = pd.DataFrame(np.random.randn(20,3), columns=["a", "b", "c"])
st.line_chart(dataframe) # Line
st.area_chart(dataframe) # Chart
st.bar_chart(dataframe) # Bar
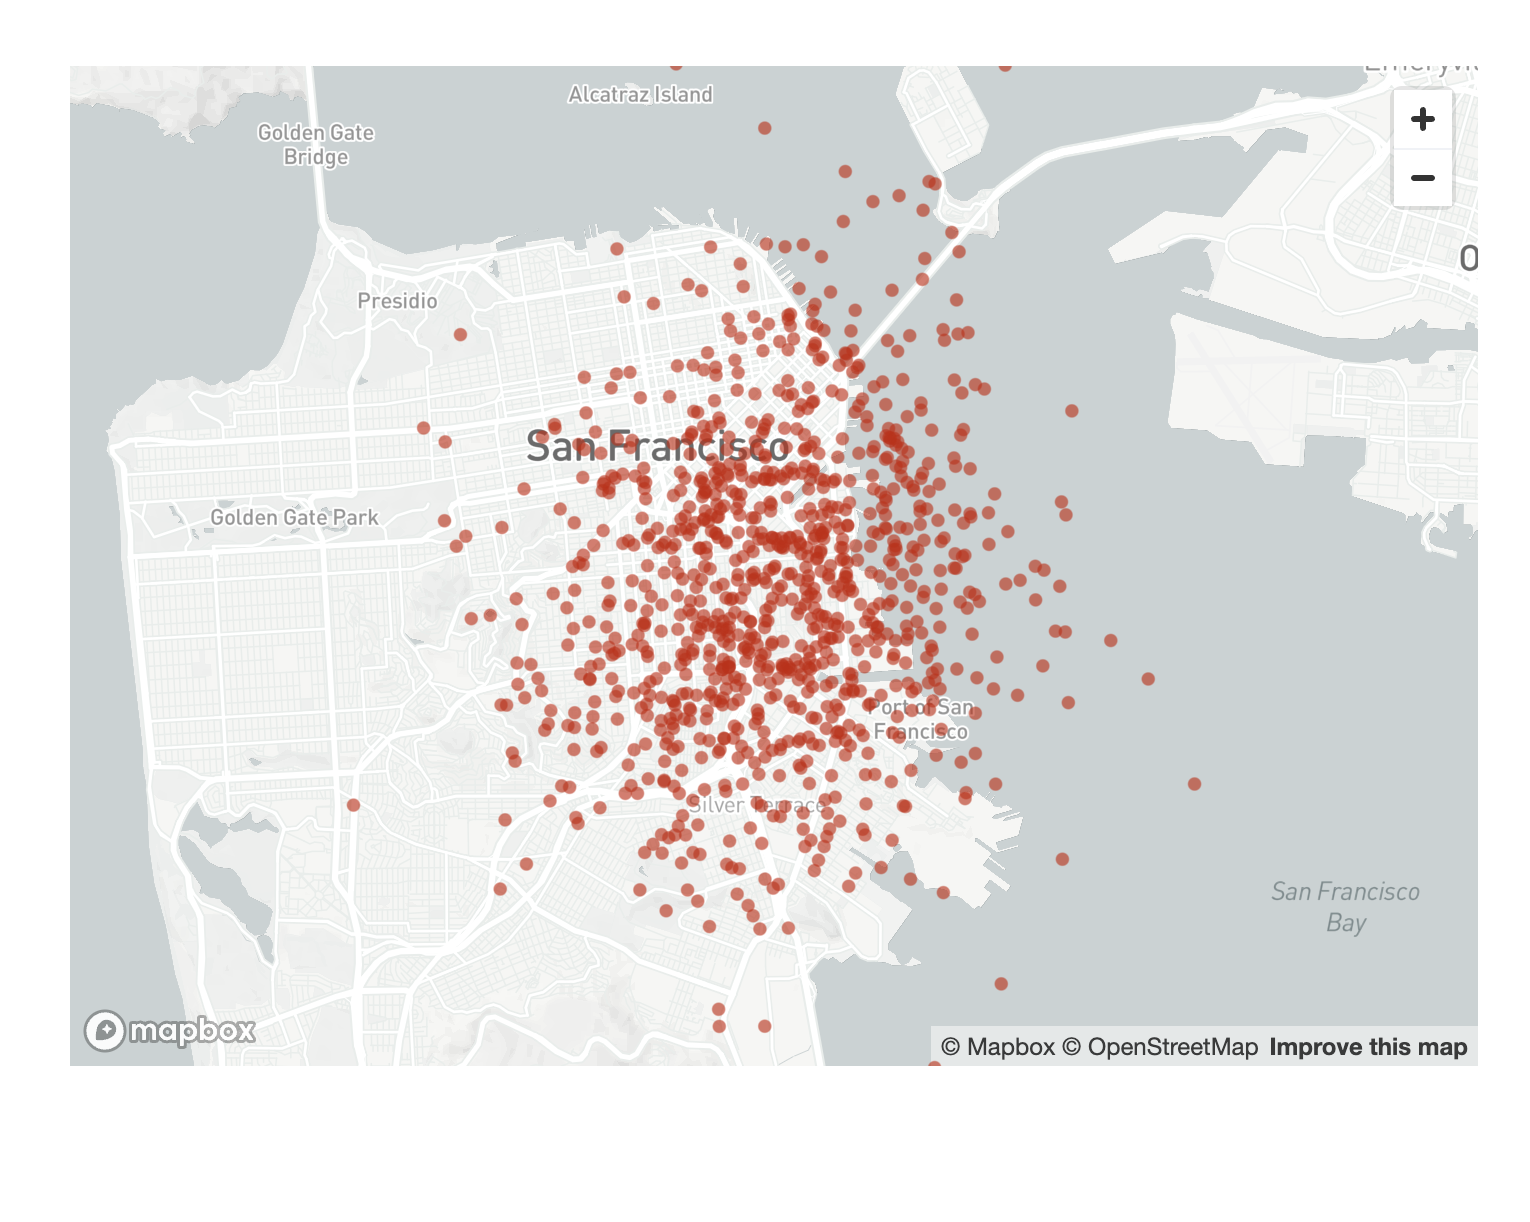
マップ
Streamlitでは、地理的なデータを表示するための組み込みサポートが提供されています。
app.py
import streamlit as st
import pandas as pd
import numpy as np

df = pd.DataFrame(
    np.random.randn(1000, 2) / [50, 50] + [37.76, -122.4],
    columns=['lat', 'lon'])
st.map(df)
参考
AlloyDB
Amazon Cognito
Amazon EC2
Amazon ECS
Amazon QuickSight
Amazon RDS
Amazon Redshift
Amazon S3
API
Autonomous Vehicle
AWS
AWS API Gateway
AWS Chalice
AWS Control Tower
AWS IAM
AWS Lambda
AWS VPC
BERT
BigQuery
Causal Inference
ChatGPT
Chrome Extension
CircleCI
Classification
Cloud Functions
Cloud IAM
Cloud Run
Cloud Storage
Clustering
CSS
Data Engineering
Data Modeling
Database
dbt
Decision Tree
Deep Learning
Descriptive Statistics
Differential Equation
Dimensionality Reduction
Discrete Choice Model
Docker
Economics
FastAPI
Firebase
GIS
git
GitHub
GitHub Actions
Google
Google Cloud
Google Search Console
Hugging Face
Hypothesis Testing
Inferential Statistics
Interval Estimation
JavaScript
Jinja
Kedro
Kubernetes
LightGBM
Linux
LLM
Mac
Machine Learning
Macroeconomics
Marketing
Mathematical Model
Meltano
MLflow
MLOps
MySQL
NextJS
NLP
Nodejs
NoSQL
ONNX
OpenAI
Optimization Problem
Optuna
Pandas
Pinecone
PostGIS
PostgreSQL
Probability Distribution
Product
Project
Psychology
Python
PyTorch
QGIS
R
ReactJS
Regression
Rideshare
SEO
Singer
sklearn
Slack
Snowflake
Software Development
SQL
Statistical Model
Statistics
Streamlit
Tabular
Tailwind CSS
TensorFlow
Terraform
Transportation
TypeScript
Urban Planning
Vector Database
Vertex AI
VSCode
XGBoost