はじめに
ヒストグラムは、異なる区間(ビン)内の値の頻度やカウントを視覚化することで、データセットの分布を理解するための可視化ツールです。この記事では、Pandasを使用してヒストグラムをプロットする方法を紹介します。
単変数のヒストグラム
まず、必要なライブラリをインポートし、データを生成します。
python
import pandas as pd
import matplotlib.pyplot as plt
import numpy as np

# Generating a DataFrame with 1000 random values
np.random.seed(0)  # To maintain consistency in generated values
df = pd.DataFrame({'Value':np.random.normal(10, 2, 1000)})
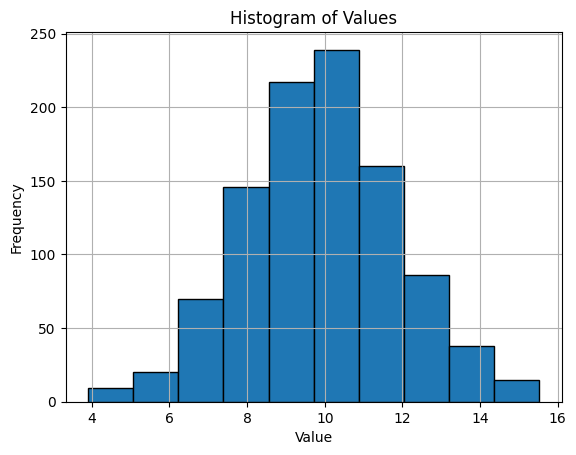
平均が10で標準偏差が2の正規分布から抽出された1000個の観測値を持つDataFrame dfがあります。次に、hist()メソッドを使用してヒストグラムをプロットします。
python
df['Value'].hist(edgecolor='black')
plt.title('Histogram of Values')
plt.xlabel('Value')
plt.ylabel('Frequency')
plt.show()

複数変数のヒストグラム
複数の変数に対して、DataFrameに別の列を追加します。
df['Value_2'] = np.random.normal(15, 3, 1000)
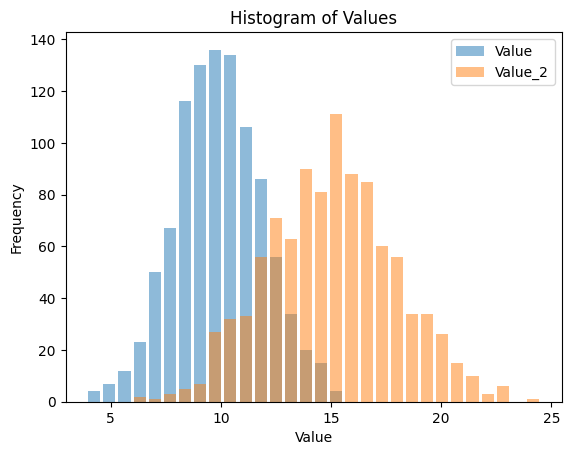
ここでは、平均が15で標準偏差が3の正規分布から抽出された1000個の観測値を持つValue_2という新しい列を作成しました。両方の変数に対してヒストグラムをプロットします。
python
df[['Value', 'Value_2']].plot(kind='hist', rwidth=0.8, alpha=0.5, bins=30)
plt.title('Histogram of Values')
plt.xlabel('Value')
plt.ylabel('Frequency')
plt.show()

このコードは、ValueとValue_2の重ね合わせたヒストグラムを生成します。alphaパラメータは色の透明度を制御し、重なり合った領域を見ることができます。
ビンのサイズの変更
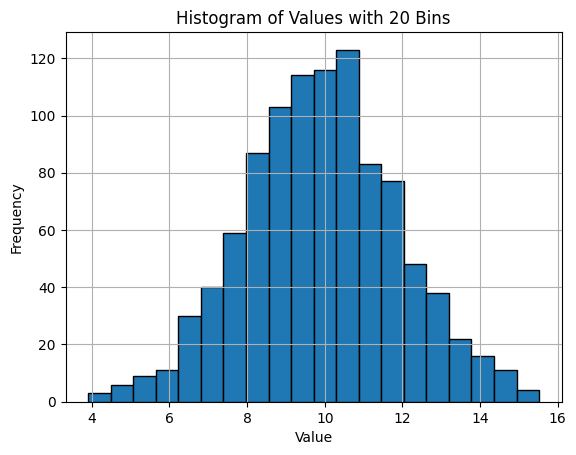
hist()関数のbins引数は、範囲内に均等に配置されるビンの数を決定します。ビンのサイズを20に変更してみます。
python
df['Value'].hist(bins=20, edgecolor='black')
plt.title('Histogram of Values with 20 Bins')
plt.xlabel('Value')
plt.ylabel('Frequency')
plt.show()

タイトルとラベルの追加
タイトルとラベルを追加するには、plt.title()、plt.xlabel()、およびplt.ylabel()を使用します。すでにこれらの関数を上記で使用しています。
色とスタイルの変更
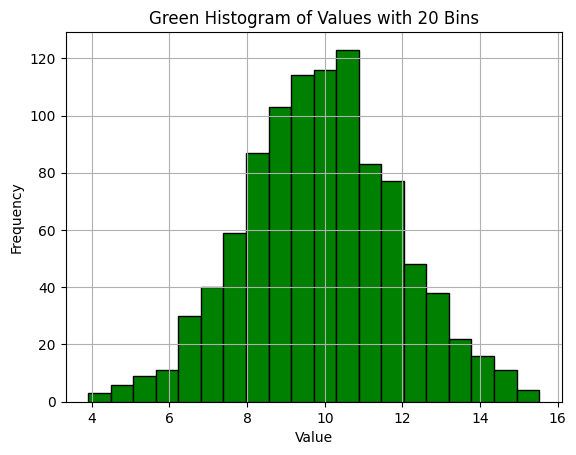
ヒストグラムの色はcolorパラメータを使用して変更し、グリッドを追加するにはplt.grid()を使用します。
python
df['Value'].hist(bins=20, color='green', edgecolor='black')
plt.title('Green Histogram of Values with 20 Bins')
plt.xlabel('Value')
plt.ylabel('Frequency')
plt.grid(True)
plt.show()

このコードは、ヒストグラムの色を緑に変更し、視認性を向上させるためにグリッドを追加します。好みに応じて他の色やスタイルを選択することができます。
AlloyDB
Amazon Cognito
Amazon EC2
Amazon ECS
Amazon QuickSight
Amazon RDS
Amazon Redshift
Amazon S3
API
Autonomous Vehicle
AWS
AWS API Gateway
AWS Chalice
AWS Control Tower
AWS IAM
AWS Lambda
AWS VPC
BERT
BigQuery
Causal Inference
ChatGPT
Chrome Extension
CircleCI
Classification
Cloud Functions
Cloud IAM
Cloud Run
Cloud Storage
Clustering
CSS
Data Engineering
Data Modeling
Database
dbt
Decision Tree
Deep Learning
Descriptive Statistics
Differential Equation
Dimensionality Reduction
Discrete Choice Model
Docker
Economics
FastAPI
Firebase
GIS
git
GitHub
GitHub Actions
Google
Google Cloud
Google Search Console
Hugging Face
Hypothesis Testing
Inferential Statistics
Interval Estimation
JavaScript
Jinja
Kedro
Kubernetes
LightGBM
Linux
LLM
Mac
Machine Learning
Macroeconomics
Marketing
Mathematical Model
Meltano
MLflow
MLOps
MySQL
NextJS
NLP
Nodejs
NoSQL
ONNX
OpenAI
Optimization Problem
Optuna
Pandas
Pinecone
PostGIS
PostgreSQL
Probability Distribution
Product
Project
Psychology
Python
PyTorch
QGIS
R
ReactJS
Regression
Rideshare
SEO
Singer
sklearn
Slack
Snowflake
Software Development
SQL
Statistical Model
Statistics
Streamlit
Tabular
Tailwind CSS
TensorFlow
Terraform
Transportation
TypeScript
Urban Planning
Vector Database
Vertex AI
VSCode
XGBoost