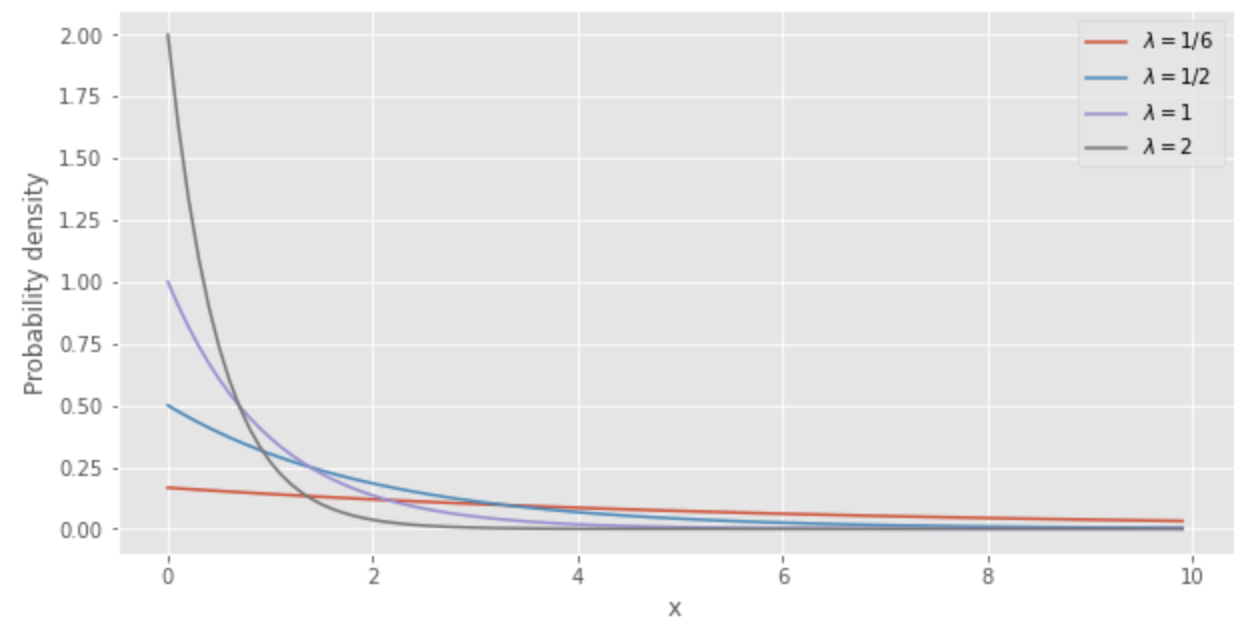
What is the exponential distribution
The exponential distribution is the probability distribution that the next time
- A call center where the phone rings an average of 20 times per hour, and the time until the next call rings
- Time until the next occurrence of a disaster that occurs once every two years
The probability density function of the exponential distribution can be expressed as follows:
Where
The exponential distribution of

The smaller the value of
Expected value and variance of exponential distribution
The expected value and variance of the exponential distribution are respectively:
Memoryless of exponential distribution
If the random variable
The above equation implies that the time until the occurrence of a future event is independent of the existence of that past event. This property is called memoryless. Exponential distribution is the only continuous distribution with the memoryless.
Relationship to Poisson distribution
The exponential distribution is a probability distribution that follows the time it takes for an event to occur, while the Poisson distribution is a probability distribution that follows the number of times an event occurs in a unit of time. In other words, the exponential distribution considers the same event in terms of time, while the Poisson distribution considers it in terms of number of times.
Python Code
The following Python code can be used to plot the exponential distribution.
from scipy.stats import expon
import numpy as np
import matplotlib.pyplot as plt
%matplotlib inline

plt.style.use('ggplot')
plt.figure(figsize=(10,5))

x = np.arange(0, 10, 0.1)
y_1_6 = expon.pdf(x=x, scale=6)
y_1_2 = expon.pdf(x=x, scale=2)
y_1 = expon.pdf(x=x, scale=1)
y_2 = expon.pdf(x=x, scale=1/2)
plt.plot(x, y_1_6, label='$\lambda=1/6$')
plt.plot(x, y_1_2, label='$\lambda=1/2$')
plt.plot(x, y_1, label='$\lambda=1$')
plt.plot(x, y_2, label='$\lambda=2$')
plt.legend()
plt.xlabel("x")
plt.ylabel("Probability density")
