


What is Dirichlet distribution
The Dirichlet distribution is the distribution that the probability
The probability density function of the Dirichlet distribution is expressed by the following equation:
In the above equation, the case
Expected value and variance of Dirichlet distribution
The expected value and variance of the Dirichlet distribution are respectively as follows.
Check the effect of parameters
Let us visualize a 3-dimensional (
import numpy as np
from scipy import special
from scipy.stats import dirichlet
import matplotlib
import matplotlib.pyplot as plt

plt.style.use('ggplot')

class Dirichlet():
    def __init__(self, param: list) -> None:
        self.param = np.array(param)

    def pdf(self, x: list) -> np.float:
        x_ar = np.array(x)
        cons = np.prod(special.gamma(self.param))/(special.gamma(np.sum(self.param)))
        p = (1./cons) * np.prod(x_ar**(self.param-1))
        return p

    def plt_3d(self, nrow: int, ncol: int, n: int, zlim=None)->None:
        xdata = np.linspace(0, 1, 200)
        ydata = np.linspace(0, 1, 200)
        X,Y = np.meshgrid(xdata, ydata)
        z = []
        X[X+Y>1] = 0
        Y[X+Y>1] = 0
        for _x, _y, _z in zip(X.flatten(), Y.flatten(), (1-X-Y).flatten()):
            z.append(self.pdf([_x, _y, _z]))

        Z = np.array(z).reshape(X.shape)
        fig = plt.figure(figsize=(10, 3))
        ax = plt.axes(projection='3d')
        ax.plot_surface(X, Y, Z, cmap='plasma')
        ax.set_zlim(zlim)
        ax.set_xlabel("$x_1$")
        ax.set_ylabel("$x_2$")
        ax.set_zlabel("PDF")
        ax.set_title("Dir($\\vec{\\alpha} = $" + "%s)" % self.param)
        plt.show()

Dirichlet([1.,1.,1.]).plt_3d(2, 2, 1, zlim=(0, 2.1))
Dirichlet([5.,5.,5.]).plt_3d(2, 2, 2)
Dirichlet([5.,1.,1.]).plt_3d(2, 2, 3)
Dirichlet([1.,5.,1.]).plt_3d(2, 2, 2)
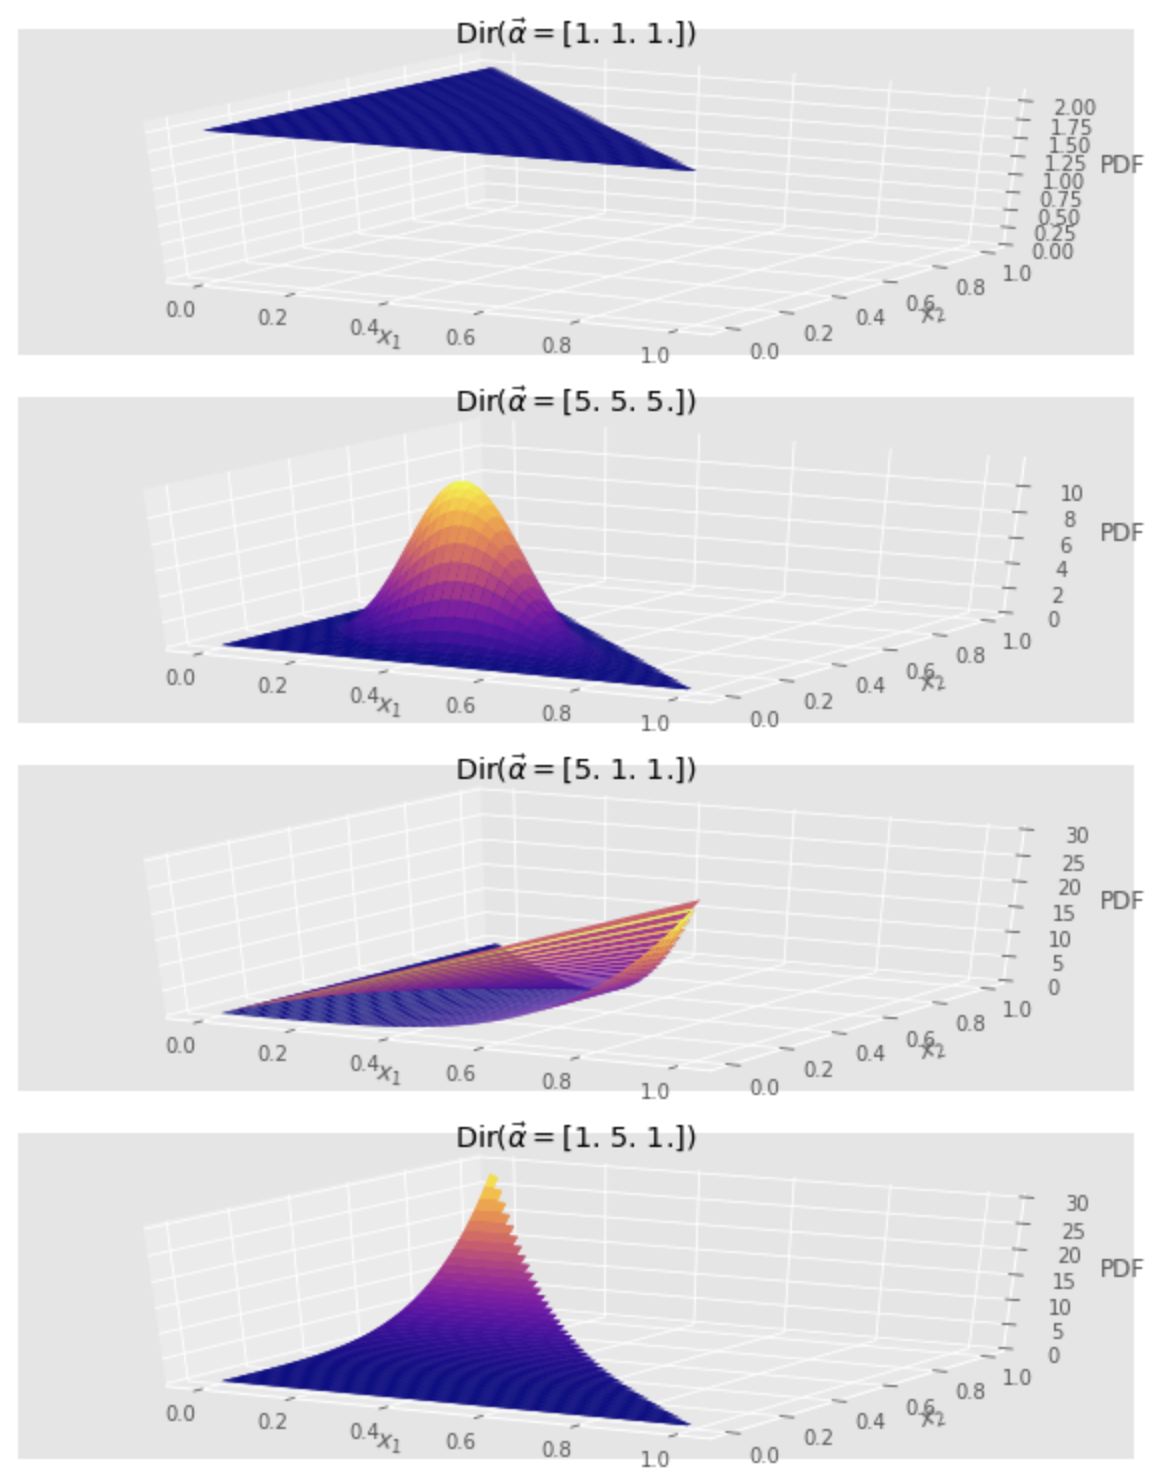
When the three


Ryusei Kakujo


Weave the future of cities through data
Transportation modeling/ Urban planning/ Machine learning/ Computer science/ GIS