

What is a Star Schema
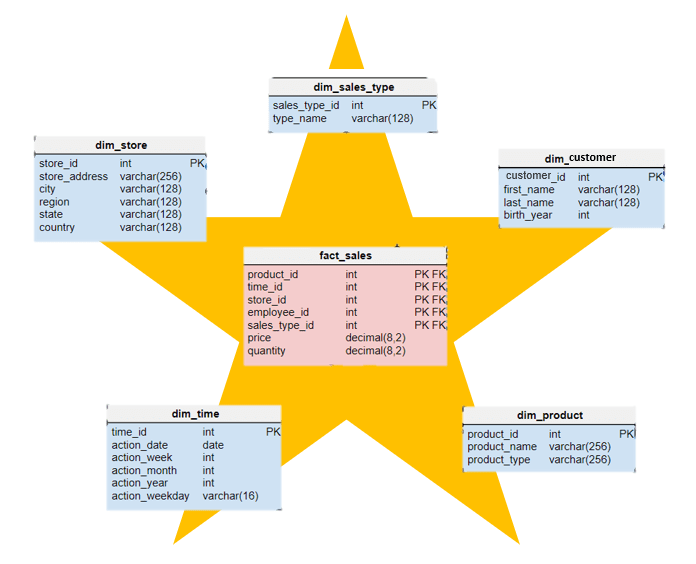
A star schema is a type of database modeling technique used in data warehousing. It organizes data into a centralized table called a fact table that is surrounded by multiple dimension tables. In a star schema, the fact table contains the quantitative data, such as sales revenue or product units sold, while the dimension tables provide the context for that data, such as the customer who made the purchase or the time period in which the sale occurred.
Star Schema: Still Relevant Almost 30 years Later?
One of the main benefits of using a star schema is its simplicity and ease of use. Because the data is organized into a simple and intuitive structure, it is easy for analysts and business users to understand and access the data. This makes it easier to perform complex queries and analysis on the data, leading to more insightful and actionable business insights.
Another benefit of using a star schema is its ability to improve query performance. By organizing data into a star schema, queries can be optimized for speed and efficiency, allowing for faster response times and more timely decision-making.
It is important to note that a star schema is a specific type of dimensional modeling technique. Dimensional modeling is a broader approach to data modeling that aims to create a structure that is optimized for querying and analysis. A star schema is one type of dimensional modeling technique that is commonly used in data warehousing, but there are other types of dimensional modeling techniques as well, such as snowflake schemas and fact constellation schemas.
Designing a Star Schema
Designing a star schema involves identifying the facts and dimensions of the data, creating the fact tables and dimension tables, and establishing relationships between them. Here is an example of how to design a star schema for a fictional e-commerce company.
Identifying Facts and Dimensions
The first step in designing a star schema is to identify the facts and dimensions. For an e-commerce company, the facts may include sales revenue, number of orders, and product returns. The dimensions may include time, product, customer, and location.
Creating Fact Tables
The fact table is the central table in the star schema that contains the quantitative data. In this example, we will create a fact table called sales_fact_table that contains sales revenue and the number of orders.
CREATE TABLE sales_fact_table (
   order_id INT,
   product_id INT,
   customer_id INT,
   time_id INT,
   location_id INT,
   revenue DECIMAL(10,2),
   orders INT
);
Creating Dimension Tables
The dimension tables provide the context for the data in the fact table. In this example, we will create dimension tables for product, customer, location, and time.
CREATE TABLE product_dim_table (
   product_id INT,
   product_name VARCHAR(50),
   category VARCHAR(50)
);

CREATE TABLE customer_dim_table (
   customer_id INT,
   customer_name VARCHAR(50),
   customer_email VARCHAR(50),
   customer_address VARCHAR(100)
);

CREATE TABLE location_dim_table (
   location_id INT,
   location_name VARCHAR(50),
   city VARCHAR(50),
   state VARCHAR(50)
);

CREATE TABLE time_dim_table (
   time_id INT,
   date DATE,
   month INT,
   year INT
);
Establishing Relationships
Once the fact and dimension tables have been created, the relationships between them must be established. In this example, the relationship between the fact table and the dimension tables is established through the use of foreign keys.
ALTER TABLE sales_fact_table ADD FOREIGN KEY (product_id) REFERENCES product_dim_table(product_id);
ALTER TABLE sales_fact_table ADD FOREIGN KEY (customer_id) REFERENCES customer_dim_table(customer_id);
ALTER TABLE sales_fact_table ADD FOREIGN KEY (location_id) REFERENCES location_dim_table(location_id);
ALTER TABLE sales_fact_table ADD FOREIGN KEY (time_id) REFERENCES time_dim_table(time_id);
Here is an example of how the star schema would look with sample data:
- Sales Fact Table:
| Order ID | Product ID | Customer ID | Time ID | Location ID | Revenue | Orders |
|---|---|---|---|---|---|---|
| 1 | 101 | 1001 | 1 | 1 | 500.00 | 2 |
| 2 | 102 | 1002 | 2 | 2 | 250.00 | 1 |
| 3 | 103 | 1003 | 3 | 3 | 1000.00 | 5 |
- Product Dimension Table:
| Product ID | Product Name | Category |
|---|---|---|
| 101 | Product A | Electronics |
| 102 | Product B | Clothing |
| 103 | Product C | Home |
- Customer Dimension Table:
| Customer ID | Customer Name | Customer Email | Customer Address |
|---|---|---|---|
| 1001 | John Smith | john@smith.com | 123 Main Street |
| 1002 | Jane Doe | jane@doe.com | 456 Maple |
Querying Star Schema
Querying a star schema involves using SQL to extract useful information from the fact and dimension tables. Here are some more examples of how to query a star schema for a fictional e-commerce company.
Aggregating and Grouping Data
Aggregating and grouping data is a common technique used in querying a star schema. This involves calculating summary statistics such as sums, averages, and counts, and grouping the data by one or more dimensions.
Example: Calculating Total Sales per Month
In this example, we will calculate the total sales revenue for each month.
SELECT time_dim_table.month, SUM(sales_fact_table.revenue) as total_sales
FROM sales_fact_table
JOIN time_dim_table ON sales_fact_table.time_id = time_dim_table.time_id
GROUP BY time_dim_table.month;
Output:
| Month | Total Sales |
|---|---|
| 1 | 5000.00 |
| 2 | 7500.00 |
| 3 | 10000.00 |
Example: Average Sales by Customer Segment
In this example, we will calculate the average sales revenue for each customer segment.
SELECT customer_dim_table.customer_segment, AVG(sales_fact_table.revenue) as avg_sales
FROM sales_fact_table
JOIN customer_dim_table ON sales_fact_table.customer_id = customer_dim_table.customer_id
GROUP BY customer_dim_table.customer_segment;
Output:
| Customer Segment | Average Sales |
|---|---|
| New Customers | 750.00 |
| Returning Customers | 1000.00 |
Handling Time-Based Analysis
Time-based analysis is a common use case for querying a star schema. This involves analyzing trends and patterns over time, such as year-over-year growth and moving averages.
Example: Year-over-Year Sales Growth
In this example, we will calculate the year-over-year sales growth for each month.
SELECT t1.month, SUM(t1.revenue) as current_year_sales, SUM(t2.revenue) as last_year_sales,
       (SUM(t1.revenue) - SUM(t2.revenue)) / SUM(t2.revenue) as yoy_growth
FROM sales_fact_table t1
JOIN sales_fact_table t2 ON t1.product_id = t2.product_id AND t1.time_id = t2.time_id
JOIN time_dim_table ON t1.time_id = time_dim_table.time_id
WHERE time_dim_table.year = 2022 AND t2.year = 2021
GROUP BY t1.month;
Output:
| Month | Current Year Sales | Last Year Sales | YoY Growth |
|---|---|---|---|
| 1 | 5000.00 | 4000.00 | 0.25 |
| 2 | 7500.00 | 6000.00 | 0.25 |
| 3 | 10000.00 | 8000.00 | 0.25 |
Example: Moving Averages in Sales
In this example, we will calculate the moving averages of sales revenue over a three-month period.
SELECT time_dim_table.month, AVG(sales_fact_table.revenue) OVER (ORDER BY time_dim_table.month ROWS BETWEEN 2 PRECEDING AND CURRENT ROW) as moving_average
FROM sales_fact_table
JOIN time_dim_table ON sales_fact_table.time_id = time_dim_table.time_id;
Output:
| Month | Moving Average |
|---|---|
| 1 | 5000.00 |
| 2 | 6250.00 |
| 3 | 750 |
References


Ryusei Kakujo


Weave the future of cities through data
Transportation modeling/ Urban planning/ Machine learning/ Computer science/ GIS