

What is Regression Discontinuity Design (RDD)
Regression Discontinuity Design (RDD) is a research method that allows us to estimate causal effects of interventions or treatments when random assignment to groups is not feasible due to ethical, practical, or other considerations. RDD makes this possible by taking advantage of a specific form of non-random assignment—the treatment or intervention is assigned based on a cutoff or threshold rule on a continuous, measurable assignment variable.
The idea is fairly simple: if an individual's score on an assignment variable (also known as a forcing variable) is above or below a certain cutoff point, that individual is assigned to a particular treatment or control group. This could be something as simple as determining who is eligible for a scholarship based on GPA or deciding which schools receive additional funding based on the socio-economic status of the community.
What makes RDD particularly powerful is its ability to estimate the causal effects of interventions in a quasi-experimental setting. That is, even though the assignment to the treatment isn't random, the design of RDD can mimic the characteristics of a randomized experiment, at least locally around the threshold. This is possible because the units just above and just below the cutoff are likely to be quite similar to each other, except for the treatment status. Hence, any discontinuous jump in the outcome at the cutoff can be attributed to the causal effect of the treatment.
Assumptions of RDD
The validity of RDD largely depends on a few key assumptions that must be satisfied. Violations of these assumptions can potentially lead to biased estimates of the causal effects.
Continuity
The most critical assumption in RDD is the continuity of the potential outcomes in the absence of treatment at the threshold. This implies that, in the absence of treatment, the functional relationship between the assignment variable and the outcome is smooth at the cutoff point. There shouldn't be a jump in this relationship at the cutoff apart from the one induced by the treatment. This assumption is necessary because it forms the basis of the local comparison in RDD that estimates the treatment effect.
Locality
The second assumption, locality, is based on the principle of local randomization or local similarity. It presumes that the units close to the cutoff are more similar to each other than to those further away. Essentially, this creates a 'mini experiment' around the threshold, where the units just below and just above the threshold serve as control and treatment groups respectively. If this assumption holds, any difference in the average outcomes between these groups can be attributed to the treatment effect.
Unmanipulability
This assumption ensures that individuals or units cannot precisely manipulate the assignment variable to ensure treatment. In other words, there should be a degree of randomness around the threshold to prevent units from guaranteeing their treatment status. If this condition is violated, it could introduce a systematic bias into the estimated treatment effect as the units just above and below the cutoff may be fundamentally different from each other.
Irrelevance
The last assumption, irrelevance, assumes that the cutoff is irrelevant for potential outcomes except through its impact on the treatment assignment. This means that the cutoff doesn't directly influence the potential outcomes other than through the treatment. If this assumption doesn't hold, the discontinuity at the cutoff may be due to reasons other than the treatment, leading to biased estimates of the treatment effect.
Derivation of Causal Effects by RDD
One of the main appeals of the RDD is its capacity to estimate causal effects in settings where the treatment assignment is not random but is based on a cutoff rule.
Estimating Causal Effects
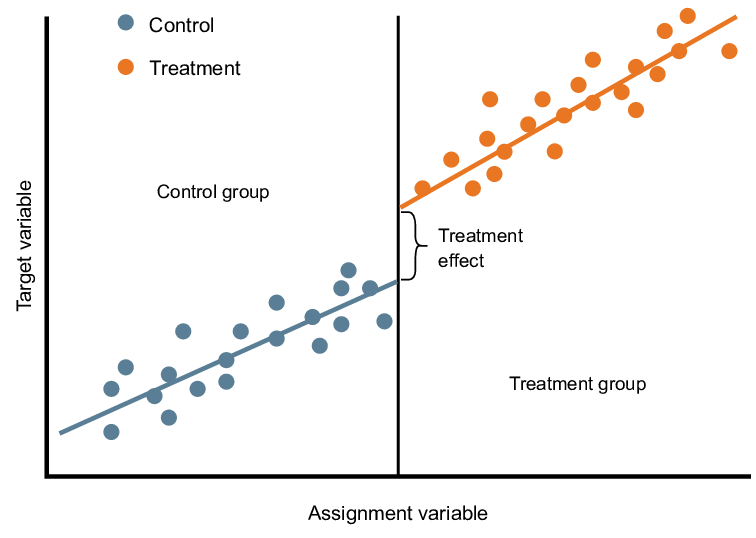
RDD estimates the causal effect of treatment by leveraging the discontinuity at the threshold of the assignment variable. The idea is that the units just below and just above the cutoff are almost identical, except for the treatment status, which jumps at the cutoff. Hence, the causal effect of the treatment can be estimated as the jump in the average outcome at the cutoff.
Mathematically, we can denote the potential outcomes of unit
Here,
The local average treatment effect (LATE) at the cutoff is then given by the difference in the limit of the expected outcomes just above and below the cutoff:
Here,
Methods and Strategies
There are various strategies and methods for estimating the LATE in RDD. These typically involve fitting separate regression models for the treatment and control groups, and then comparing the predicted outcomes at the cutoff.
Parametric Methods
Parametric methods fit a parametric regression model to the data separately on each side of the cutoff. A simple linear regression model can be formulated as:
Here,
The causal effect of the treatment at the cutoff is estimated by the coefficient
Non-parametric Methods
Non-parametric methods, on the other hand, do not impose a functional form on the relationship between the assignment variable and the outcome. Instead, they use local polynomial regression or kernel regression to estimate the expected outcomes just above and below the cutoff.
Example of RDD
To illustrate the application of RDD in practice, we will consider a hypothetical case study of an educational program aimed at improving student academic performance.
Background
Suppose a school district in the United States has implemented a scholarship program to help struggling students improve their academic performance. The program provides additional academic resources, such as free tutoring and educational materials, to students whose grade point averages (GPAs) fall below a certain threshold. In this case, the GPA threshold is set at 2.5. Any student with a GPA below this threshold is eligible for the program.
As an educational researcher, you are interested in estimating the causal effect of this program on the academic performance of students, measured by the change in GPA from one academic year to the next.
Implementation of RDD
Given the nature of the program's implementation—where a clear cutoff is established for program eligibility—RDD becomes a suitable method for estimating its effect. The forcing variable in this context is the student's GPA, and the treatment variable is whether or not the student receives the scholarship program benefits.
Firstly, you would collect data on the GPAs of students just above and just below the cutoff, along with data on their change in GPAs for the subsequent academic year.
Then, using a graphical analysis, you could visually check if there is a discontinuity or a "jump" in the average change in GPA at the cutoff point of 2.5 GPA.
Further, to formally estimate the treatment effect, you could use regression models. If you assume a linear relationship between GPA and the change in GPA, you could use a simple linear regression model. If the relationship is more complex, you might use a non-parametric method like local polynomial regression.
Through these steps, you could estimate the causal effect of the scholarship program on student academic performance, i.e., how much the program improves the GPAs of the students on average.
Analysis
Based on the results of your analysis, you could draw conclusions about the effectiveness of the scholarship program. If the program has a positive effect, you would observe a significant positive jump in the change in GPA at the cutoff point.


Ryusei Kakujo


Weave the future of cities through data
Transportation modeling/ Urban planning/ Machine learning/ Computer science/ GIS