

What is Difference-in-Differences (DID)
Difference-in-Differences (DID) is a popular econometric technique used in the social sciences to evaluate the causal effect of a treatment on an outcome. It leverages the differences in outcomes over time between a group that was exposed to a specific treatment (the treatment group) and a group that was not (the control group). The key idea is to compare the average change in the outcome for the treatment group before and after the treatment to the average change over the same period for the control group.
Introduction to Difference-in-Differences Estimation
DID aims to establish a causal link between the treatment and the outcome, removing any time-constant unobserved confounding factors that could bias the estimate. It is particularly useful when randomization of treatment is not feasible due to ethical or practical reasons.
Basic Concepts of DID
Treatment and Control Groups
The core of the DID analysis involves comparing two distinct groups: the treatment group and the control group. The treatment group consists of the entities (individuals, firms, regions, etc.) that are exposed to a specific policy or intervention. The control group, on the other hand, is comprised of similar entities that are not exposed to the intervention. The objective is to measure the differential effect of the treatment on the treatment group, vis-à-vis the control group.
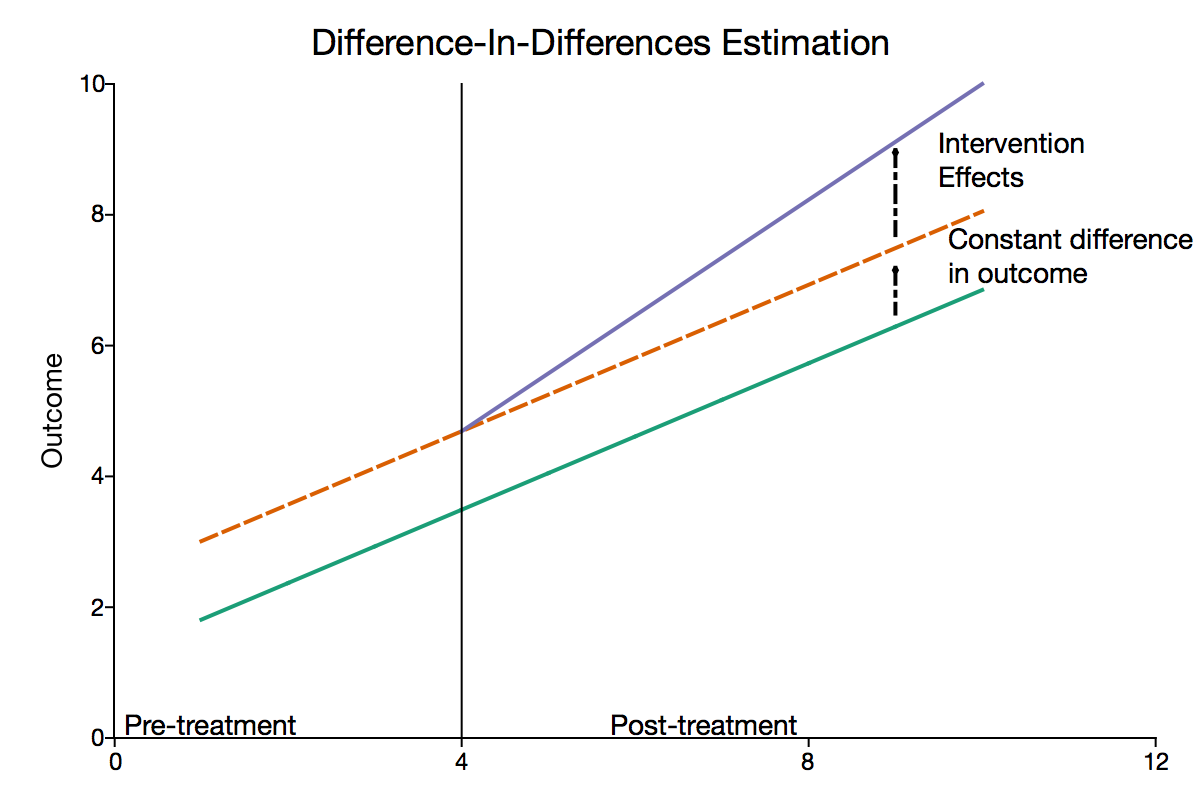
Pre-treatment and Post-treatment Periods
DID also necessitates having data from both before and after the intervention for both the treatment and control groups. These periods are often referred to as the pre-treatment and post-treatment periods. The pre-treatment period is crucial for establishing the baseline characteristics and trends of the two groups, while the post-treatment period allows for the measurement of the impact of the intervention.
Calculating the Differences
The essence of DID lies in its name: calculating two differences and then comparing them. The first difference is the change in the outcome in the treatment group from the pre-treatment period to the post-treatment period. The second difference is the change in the outcome in the control group over the same period. The key insight from DID analysis comes from the difference between these two changes, which estimates the causal impact of the treatment.
Assumptions of DID
The credibility of DID estimates heavily rests on certain assumptions. These assumptions are critical for obtaining unbiased estimates of the treatment effect. Below we elaborate on these foundational assumptions.
Parallel Trends Assumption
The parallel trends assumption, also known as the common trends assumption, is the key assumption underpinning DID methodology. It posits that in the absence of treatment, the average trends in outcomes would have been the same for the treatment and control groups. In other words, any differences in trends between these groups after the treatment can be attributed solely to the treatment effect.
Independence of Treatment Status
The assumption of independence of treatment status implies that the assignment to the treatment group is not correlated with unobserved factors that may influence the outcome. If there are unobserved variables that affect both the treatment assignment and the outcome variable, the DID estimator could be biased.
Common Shocks Assumption
The common shocks assumption holds that the treatment and control groups are affected similarly by any events or shocks occurring over the time of study, other than the treatment itself. If there are other events that differentially affect the treatment and control groups during the study period, it may confound the DID estimates.
Testing the Assumptions
While it is impossible to directly test these assumptions, there are a few strategies to provide suggestive evidence. One common approach is to graphically represent the pre-treatment trends for the treatment and control groups. If these trends are parallel, it supports the parallel trends assumption. Moreover, placebo or falsification tests can be conducted to assess the validity of DID assumptions. These involve applying the DID method to an outcome that should not be affected by the treatment.
Derivation of Causal Effects by DID
In a standard two-period, two-group setting, the typical DID model can be formulated as follows:
where:
Y_{it} i t TREAT_i i POST_t TREAT_i \cdot POST_t \epsilon_{it}
In this equation,
Each coefficient in the DID equation carries a specific meaning:
\alpha \beta \gamma \delta
Example of DID Analysis
In this chapter, I will explore a concrete example of how DID can be applied to estimate causal effects. This example concerns the evaluation of a job training program.
Background
Consider a hypothetical job training program aimed at improving the earnings of low-income individuals. The government, which sponsors the program, wants to understand its effectiveness. To evaluate the program, we'll apply a DID analysis, using data collected before and after the implementation of the program.
The treatment group consists of individuals who have undergone the job training program, while the control group consists of similar low-income individuals who have not participated in the program.
Data Collection and Preparation
We'll use panel data for this analysis, which includes the same individuals observed over time, both before and after the implementation of the program. Data includes individuals' earnings, demographic characteristics, and whether or not they participated in the job training program.
DID Analysis
We'll implement a DID analysis following the basic steps:
-
Calculate the Average Earnings in Each Group and Each Period
Compute the average earnings for the treatment and control groups, both before and after the program implementation. -
Calculate the Differences
Next, we calculate two differences. The first difference is the change in earnings in the treatment group from before to after the program. The second difference is the same change, but for the control group. -
DID
Finally, we calculate the difference in these two differences, which gives us the DID estimator. This estimates the causal effect of the job training program on earnings.
Suppose that the DID estimator is significantly positive. This would suggest that the job training program effectively improved earnings for low-income individuals.
References


Ryusei Kakujo


Weave the future of cities through data
Transportation modeling/ Urban planning/ Machine learning/ Computer science/ GIS