

What is Amazon QuickSight
Amazon QuickSight is a fully managed, cloud-based BI (Business Intelligence) service from AWS that connects to data sources such as Redshift, RDS, and SaaS data for fast data analysis and visualization. The analysis can be published and shared as dashboards. It can also be integrated with Amazon SageMaker to perform more advanced analytics such as anomaly detection and numerical prediction using machine learning.
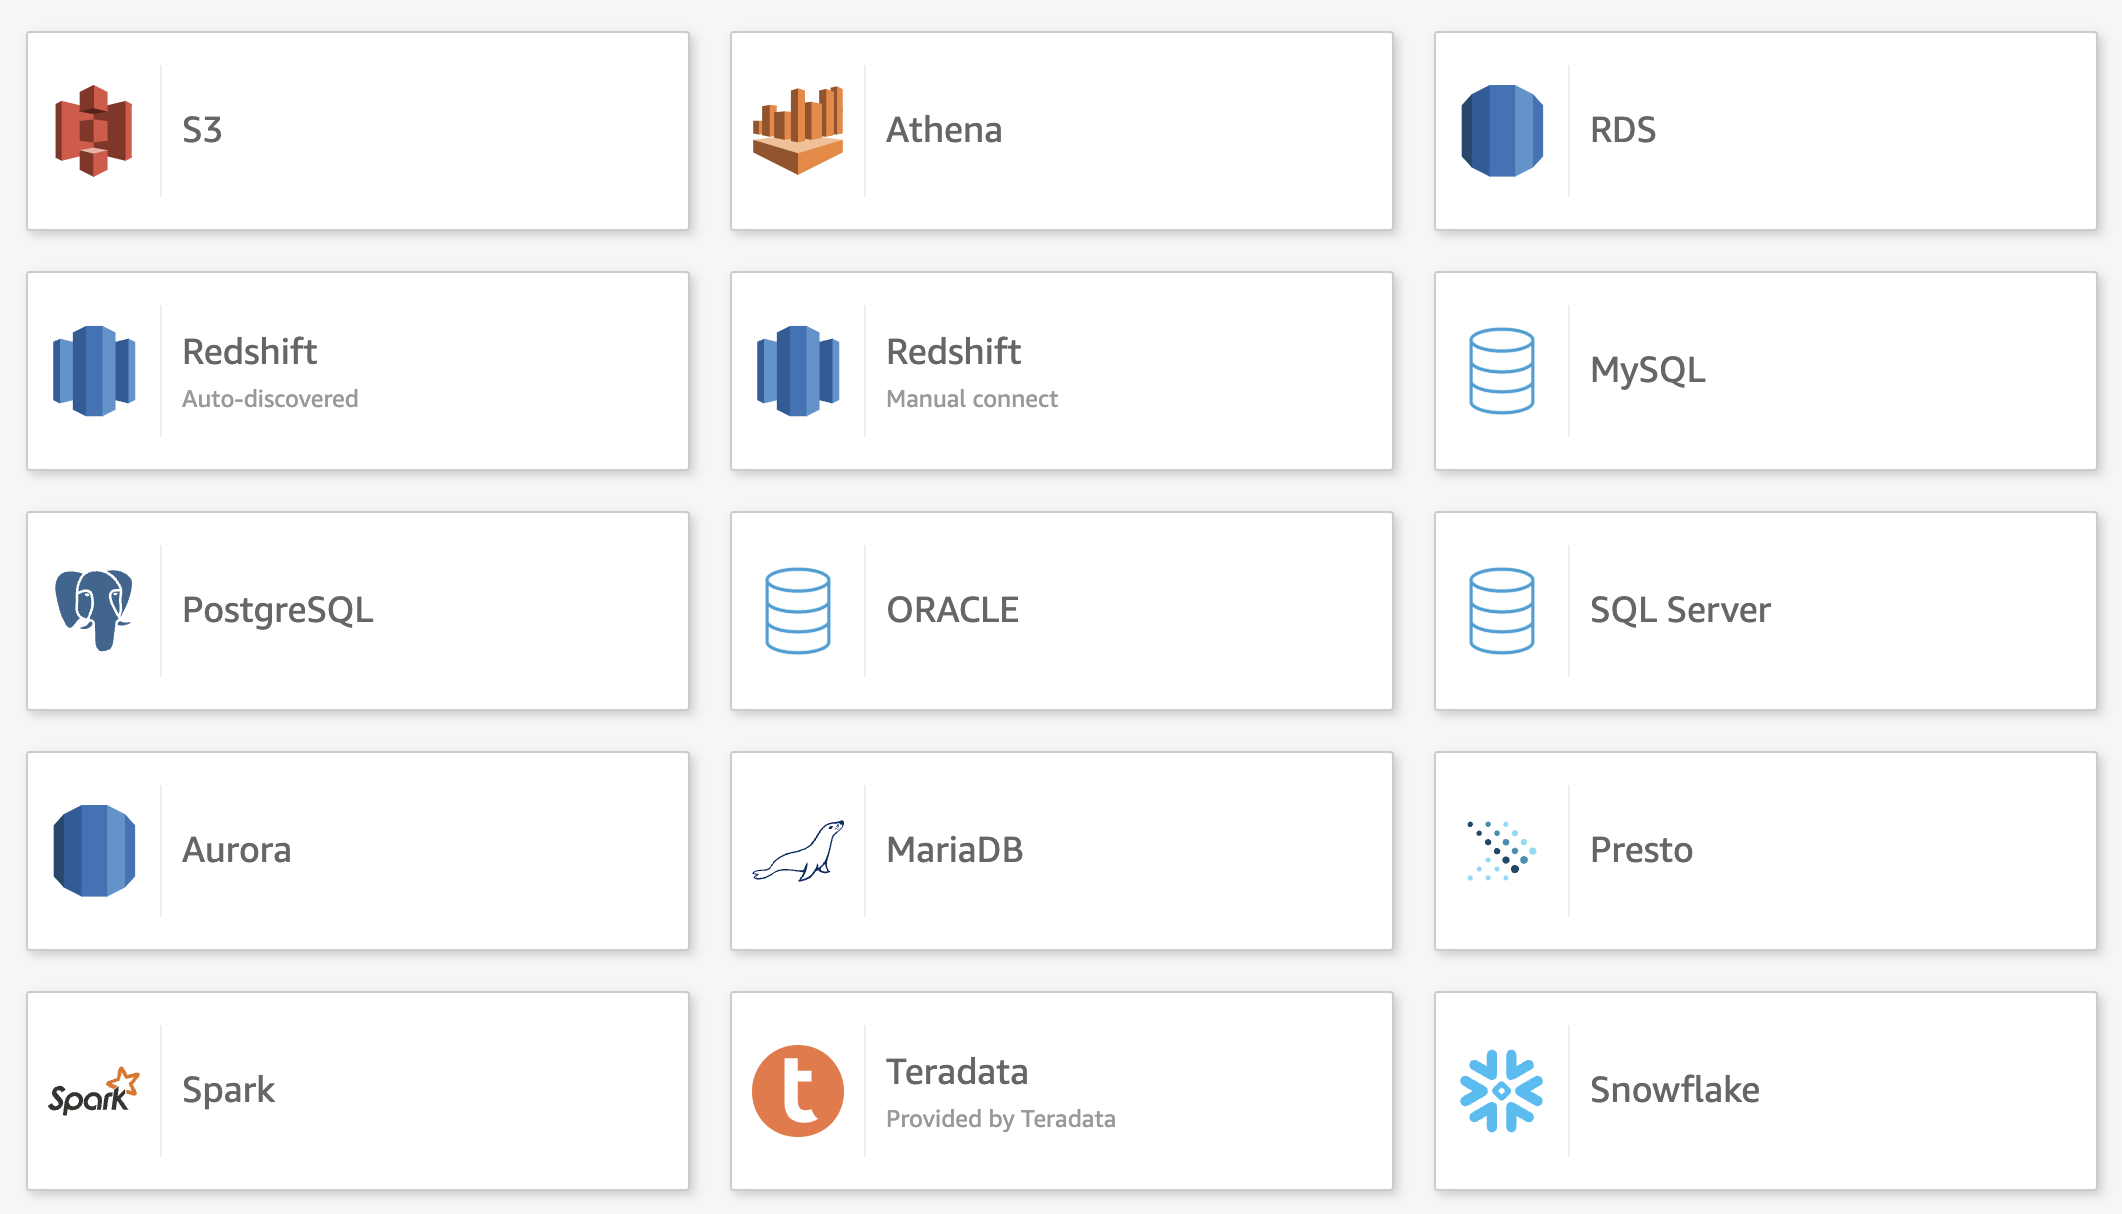
Connectable data sources
QuickSight can connect to the following data sources
- AWS services
- S3
- Athena
- RDS
- Aurora
- Redshift
- External Database
- MySQL
- PostgreSQL
- ORACLE
- SQL Server
- MariaDB
- Presto
- Snowflake
- SaaS
- Salesforce
- Jira
- GitHub
- ServiceNow
- Teradata
- Spark
- Adobe Analytics
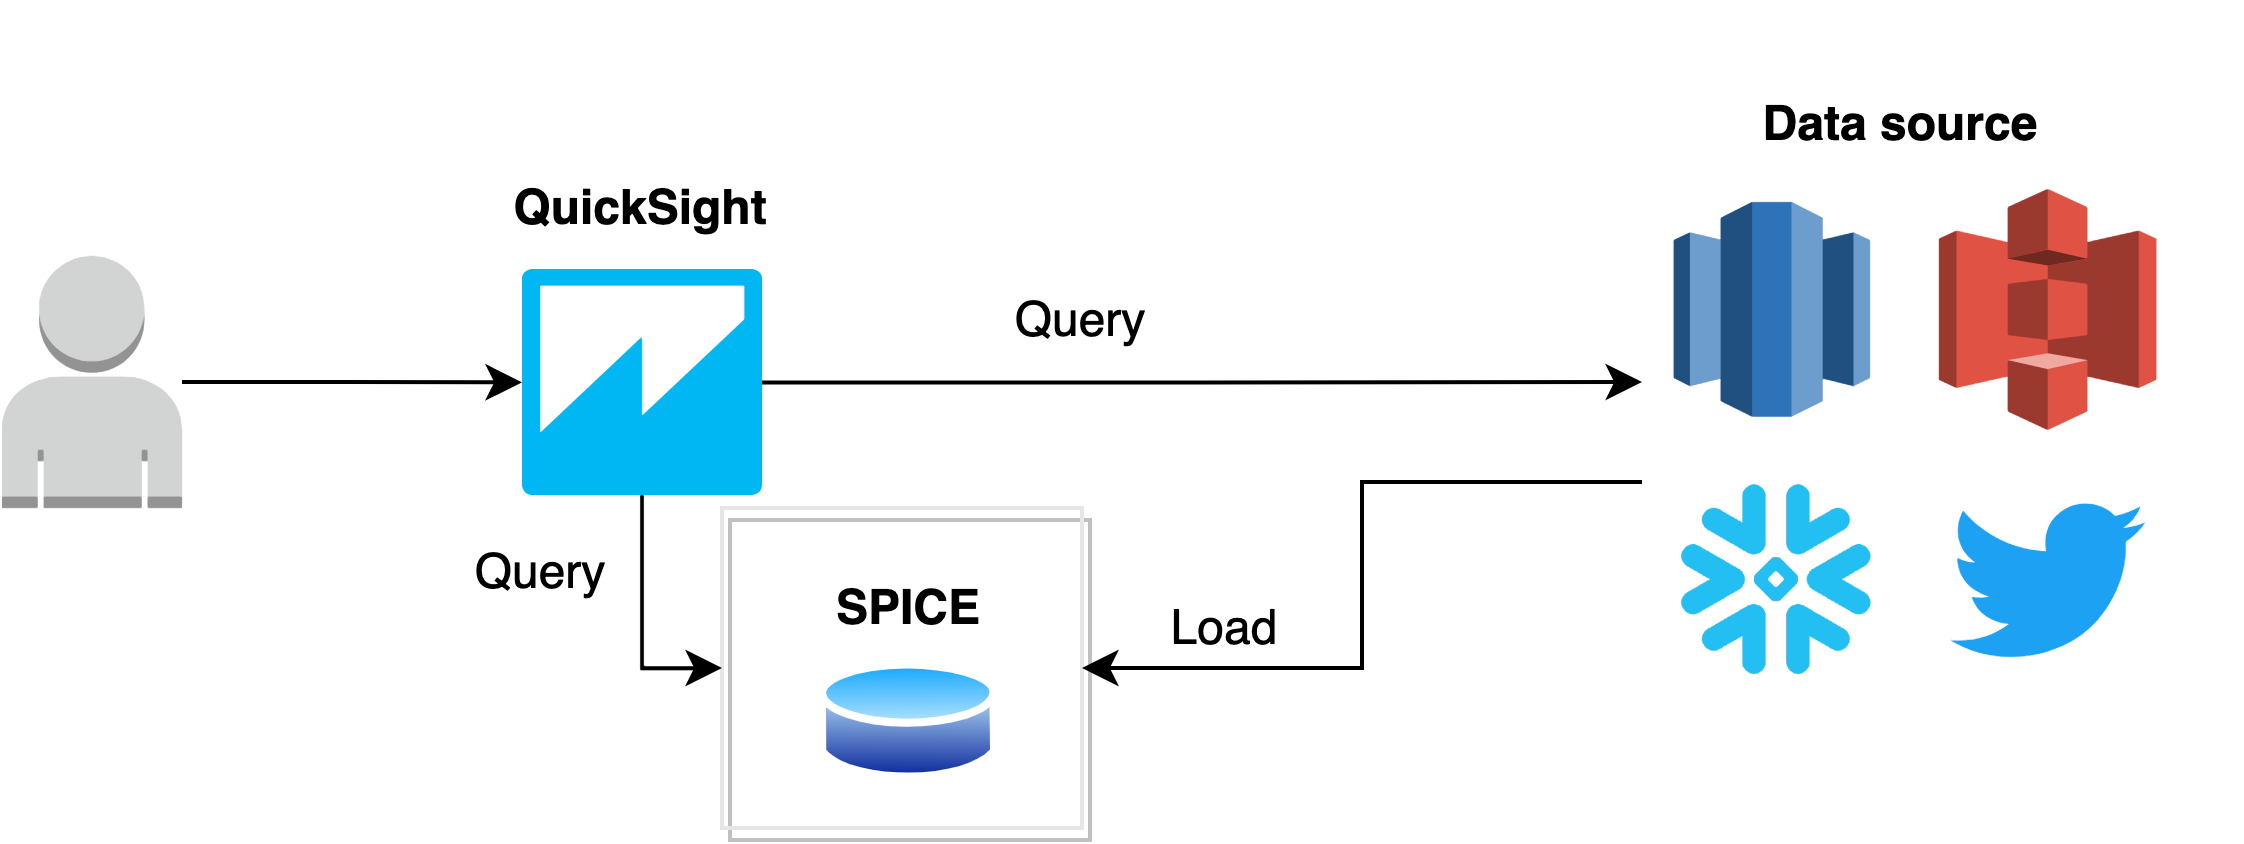
SPICE
QuickSight comes with a built-in in-memory calculation engine called SPICE, which stands for Super-fast, Parallel, In-memory Calculation Engine. Importing data sources into SPICE eliminates the need to query the data sources directly every time you change or update your analysis or visuals, thus increasing query speed and reducing the load on the data sources.
The default amount of data that can be loaded into SPICE is 10GB per user, and there is a free SPICE capacity quota of 1GB per user. The data that does not fit into SPICE is queried directly to the data source.
Edition
QuickSight is available in two editions, Standard and Enterprise, with the Enterprise Edition being more feature-rich. The Enterprise Edition has two user types that the Standard Edition does not: Author and Reader. Author users in the Enterprize Edition can take full advantage of QuickSight's features, including the creation of datasets and dashboards. Readers are charged $0.3 per session (30 minutes after login), up to a maximum of $5. The maximum charge is $5.
Below is a price comparison between Standard and Enterprise.
| Enterprize Edition | Standard Edition | |
|---|---|---|
| Free Trial Creator (30 days) | 4 | 4 |
| SPICE installed capacity | 10GB / user | 10GB / user |
| Author(annually) | $18 | $9 |
| Author(monthly) | $24 | $12 |
| Reader(monthly) | $0.30 / session ~ maximum $5 |
How to use QuickSight
The flow of using QuickSight is as follows
- Create a dataset by connecting to a data source
- Analyze and visualize data based on the dataset created
- Publish the analysis as a dashboard
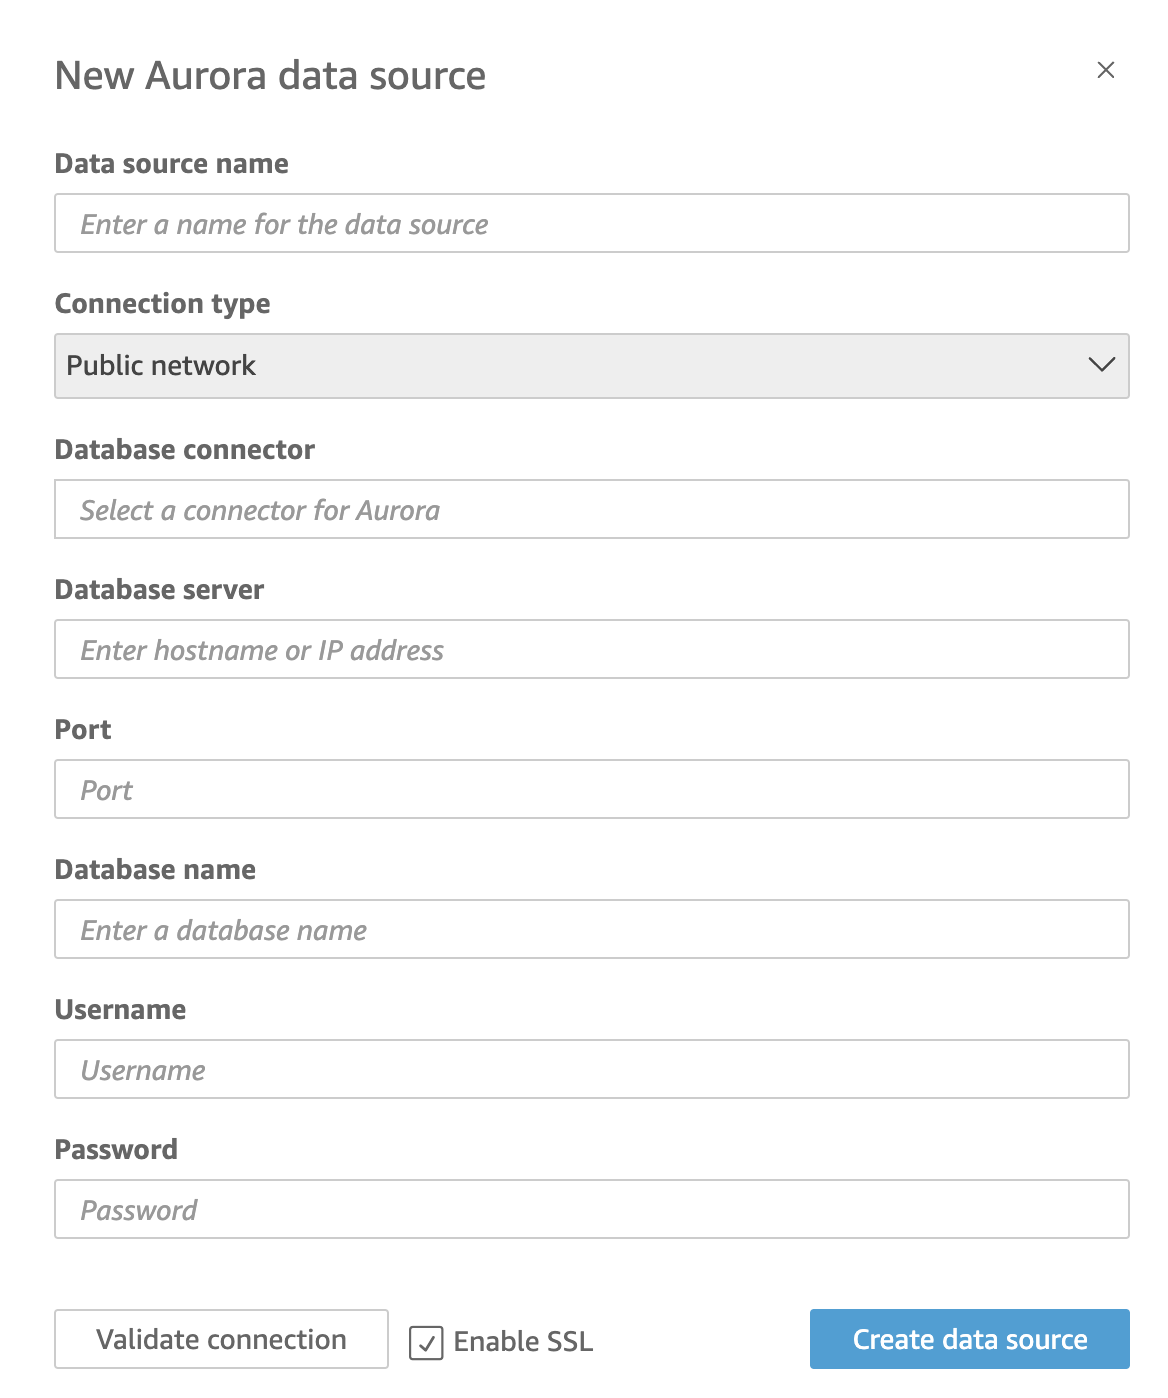
Connect to a dataset
First, select a data source.
For example, if you select Aurora, the following modal window will appear, and you can create a dataset by entering the necessary information for the connection.
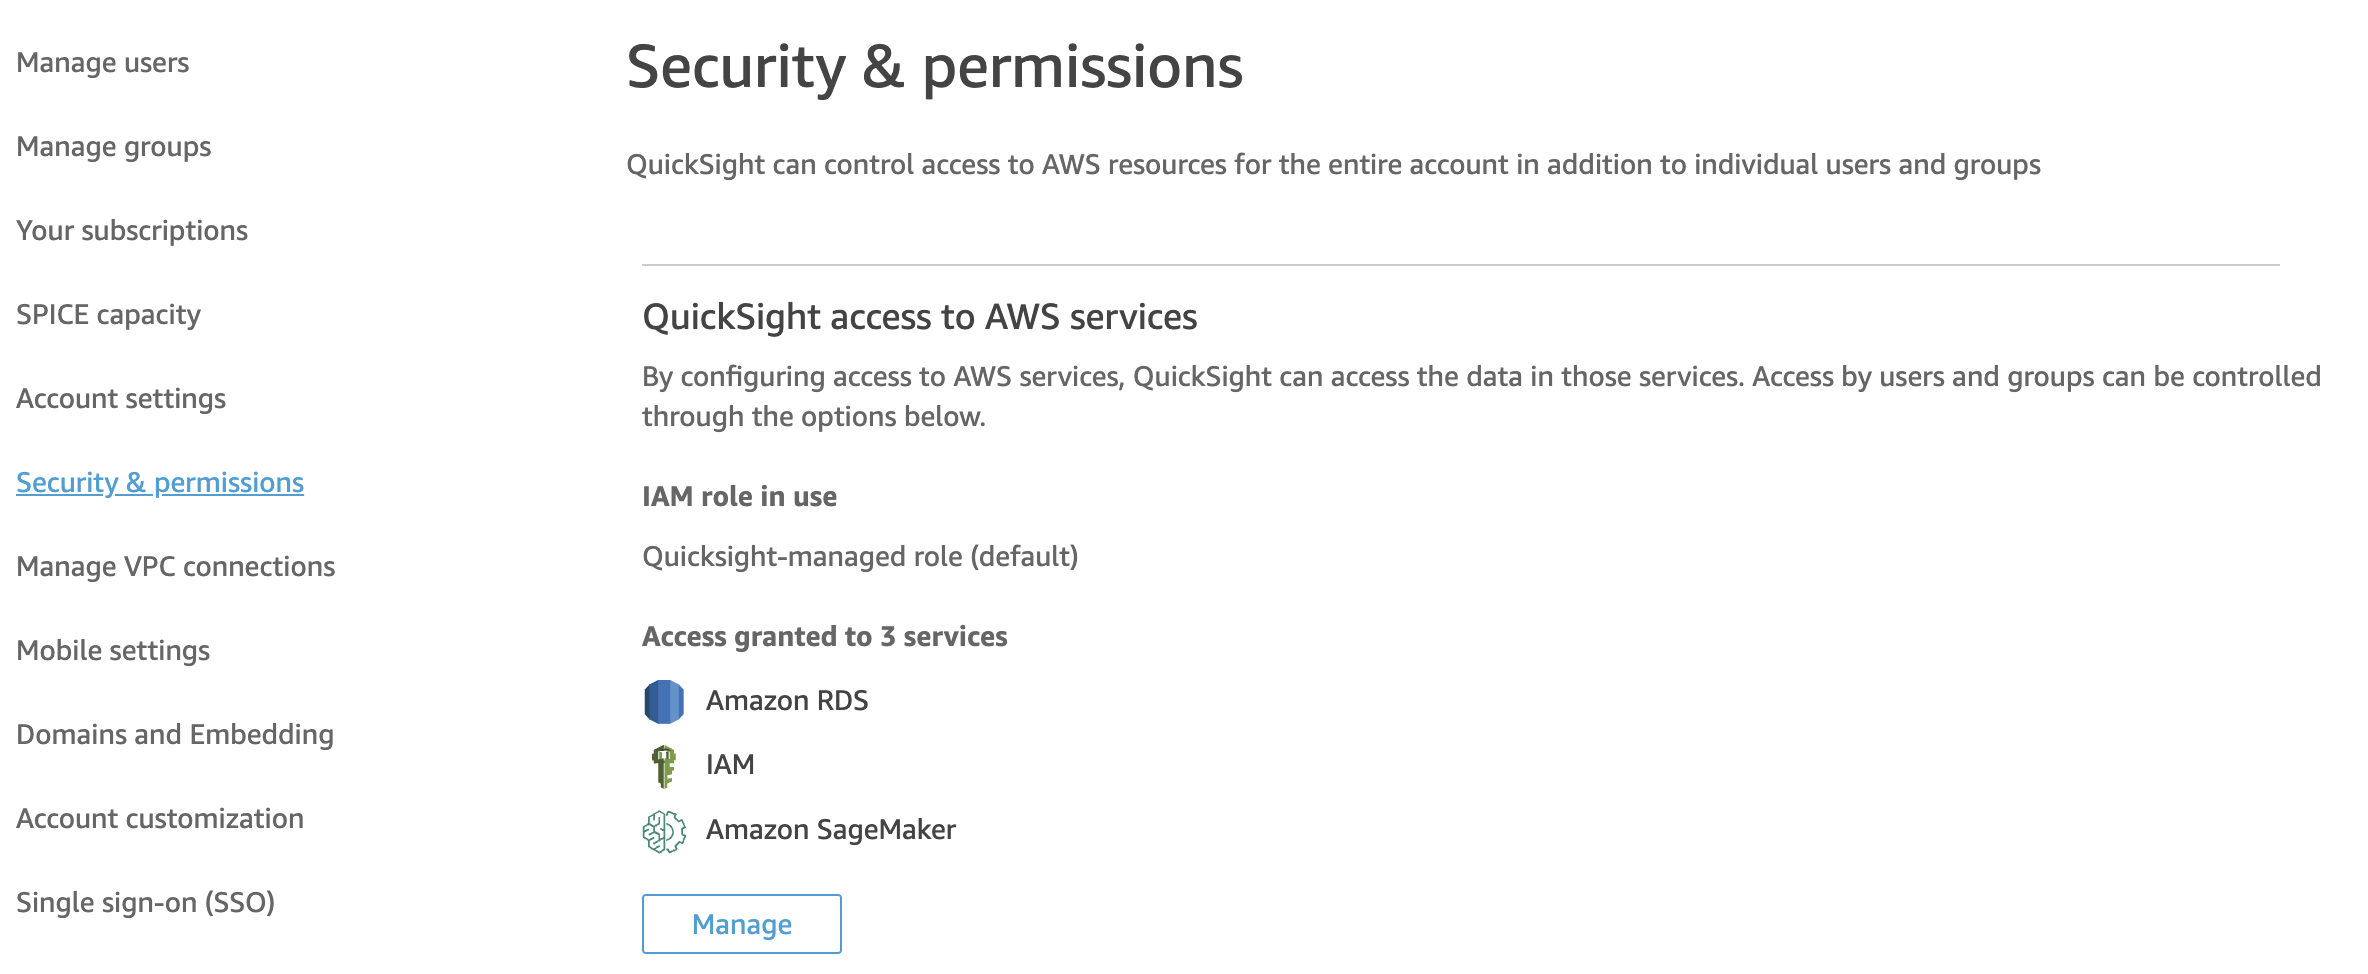
As a reminder, when connecting to AWS services, the target AWS service must be added to the "QuickSight access to AWS services" item in the "Security & permissions" section of the administration screen. In the following capture, Amazon RDS, IAM, and SageMaker are allowed to access QuickSight. If you want to use S3 as a data source, for example, you need to set S3 access permissions here.
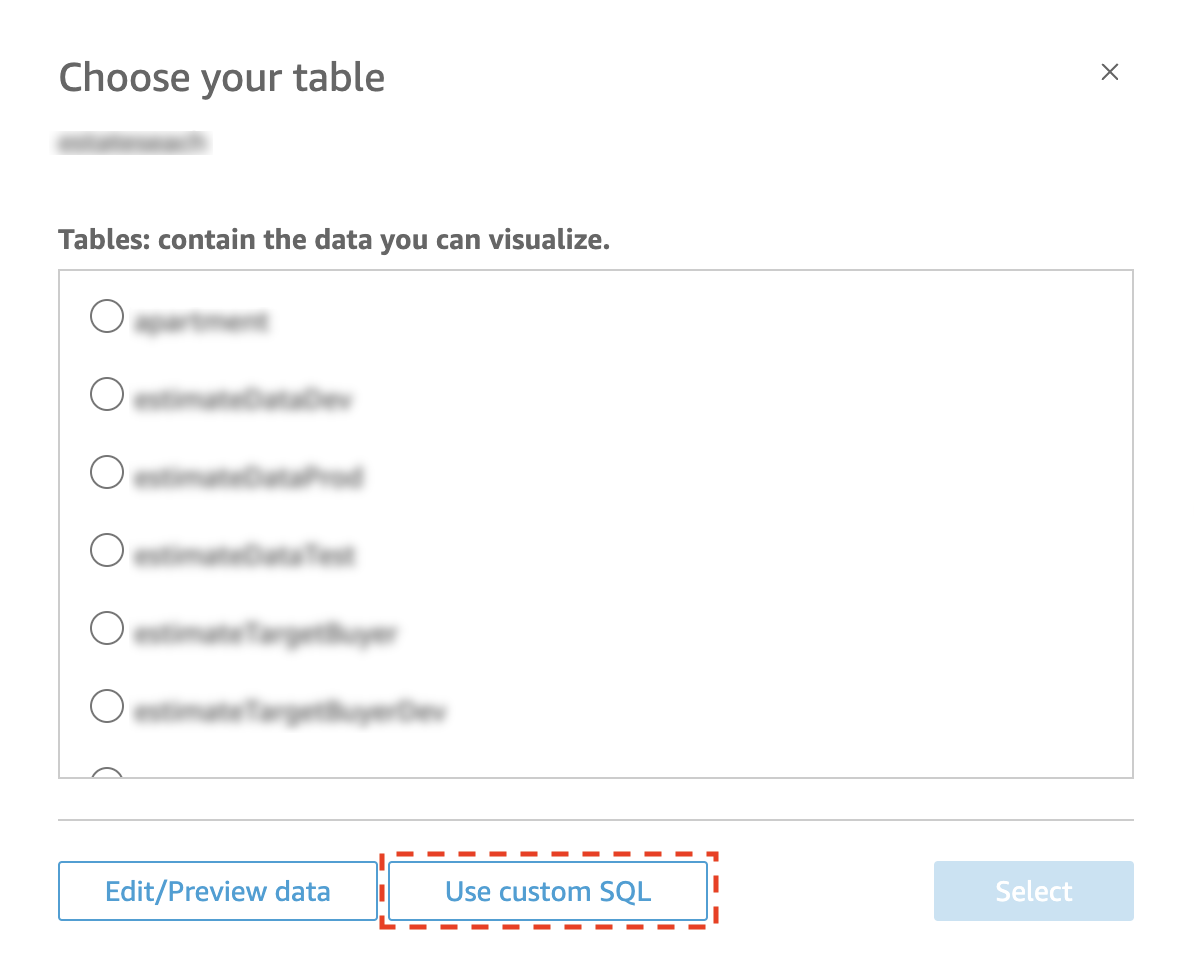
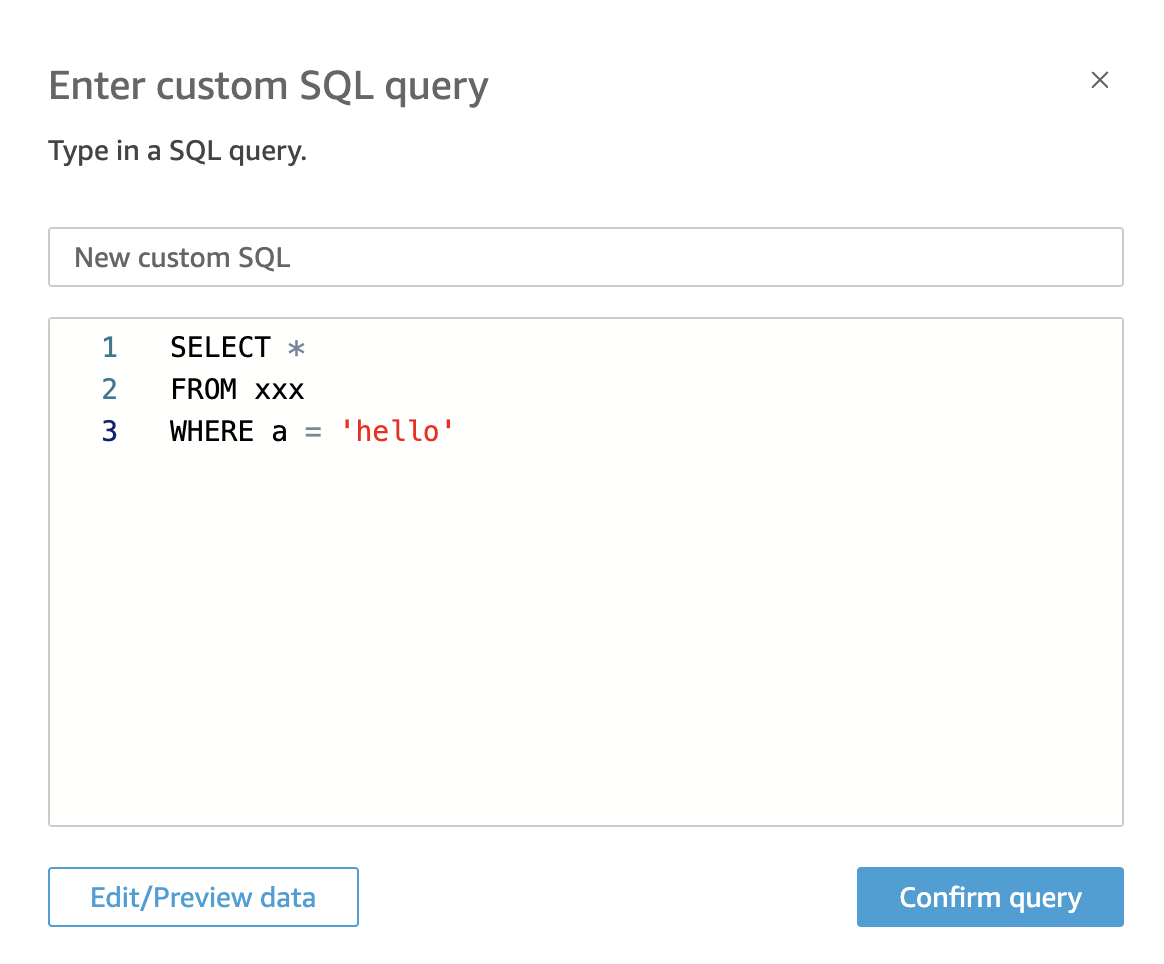
Custom SQL
If the data source is a DB, you can issue SQL to create a dataset after processing.
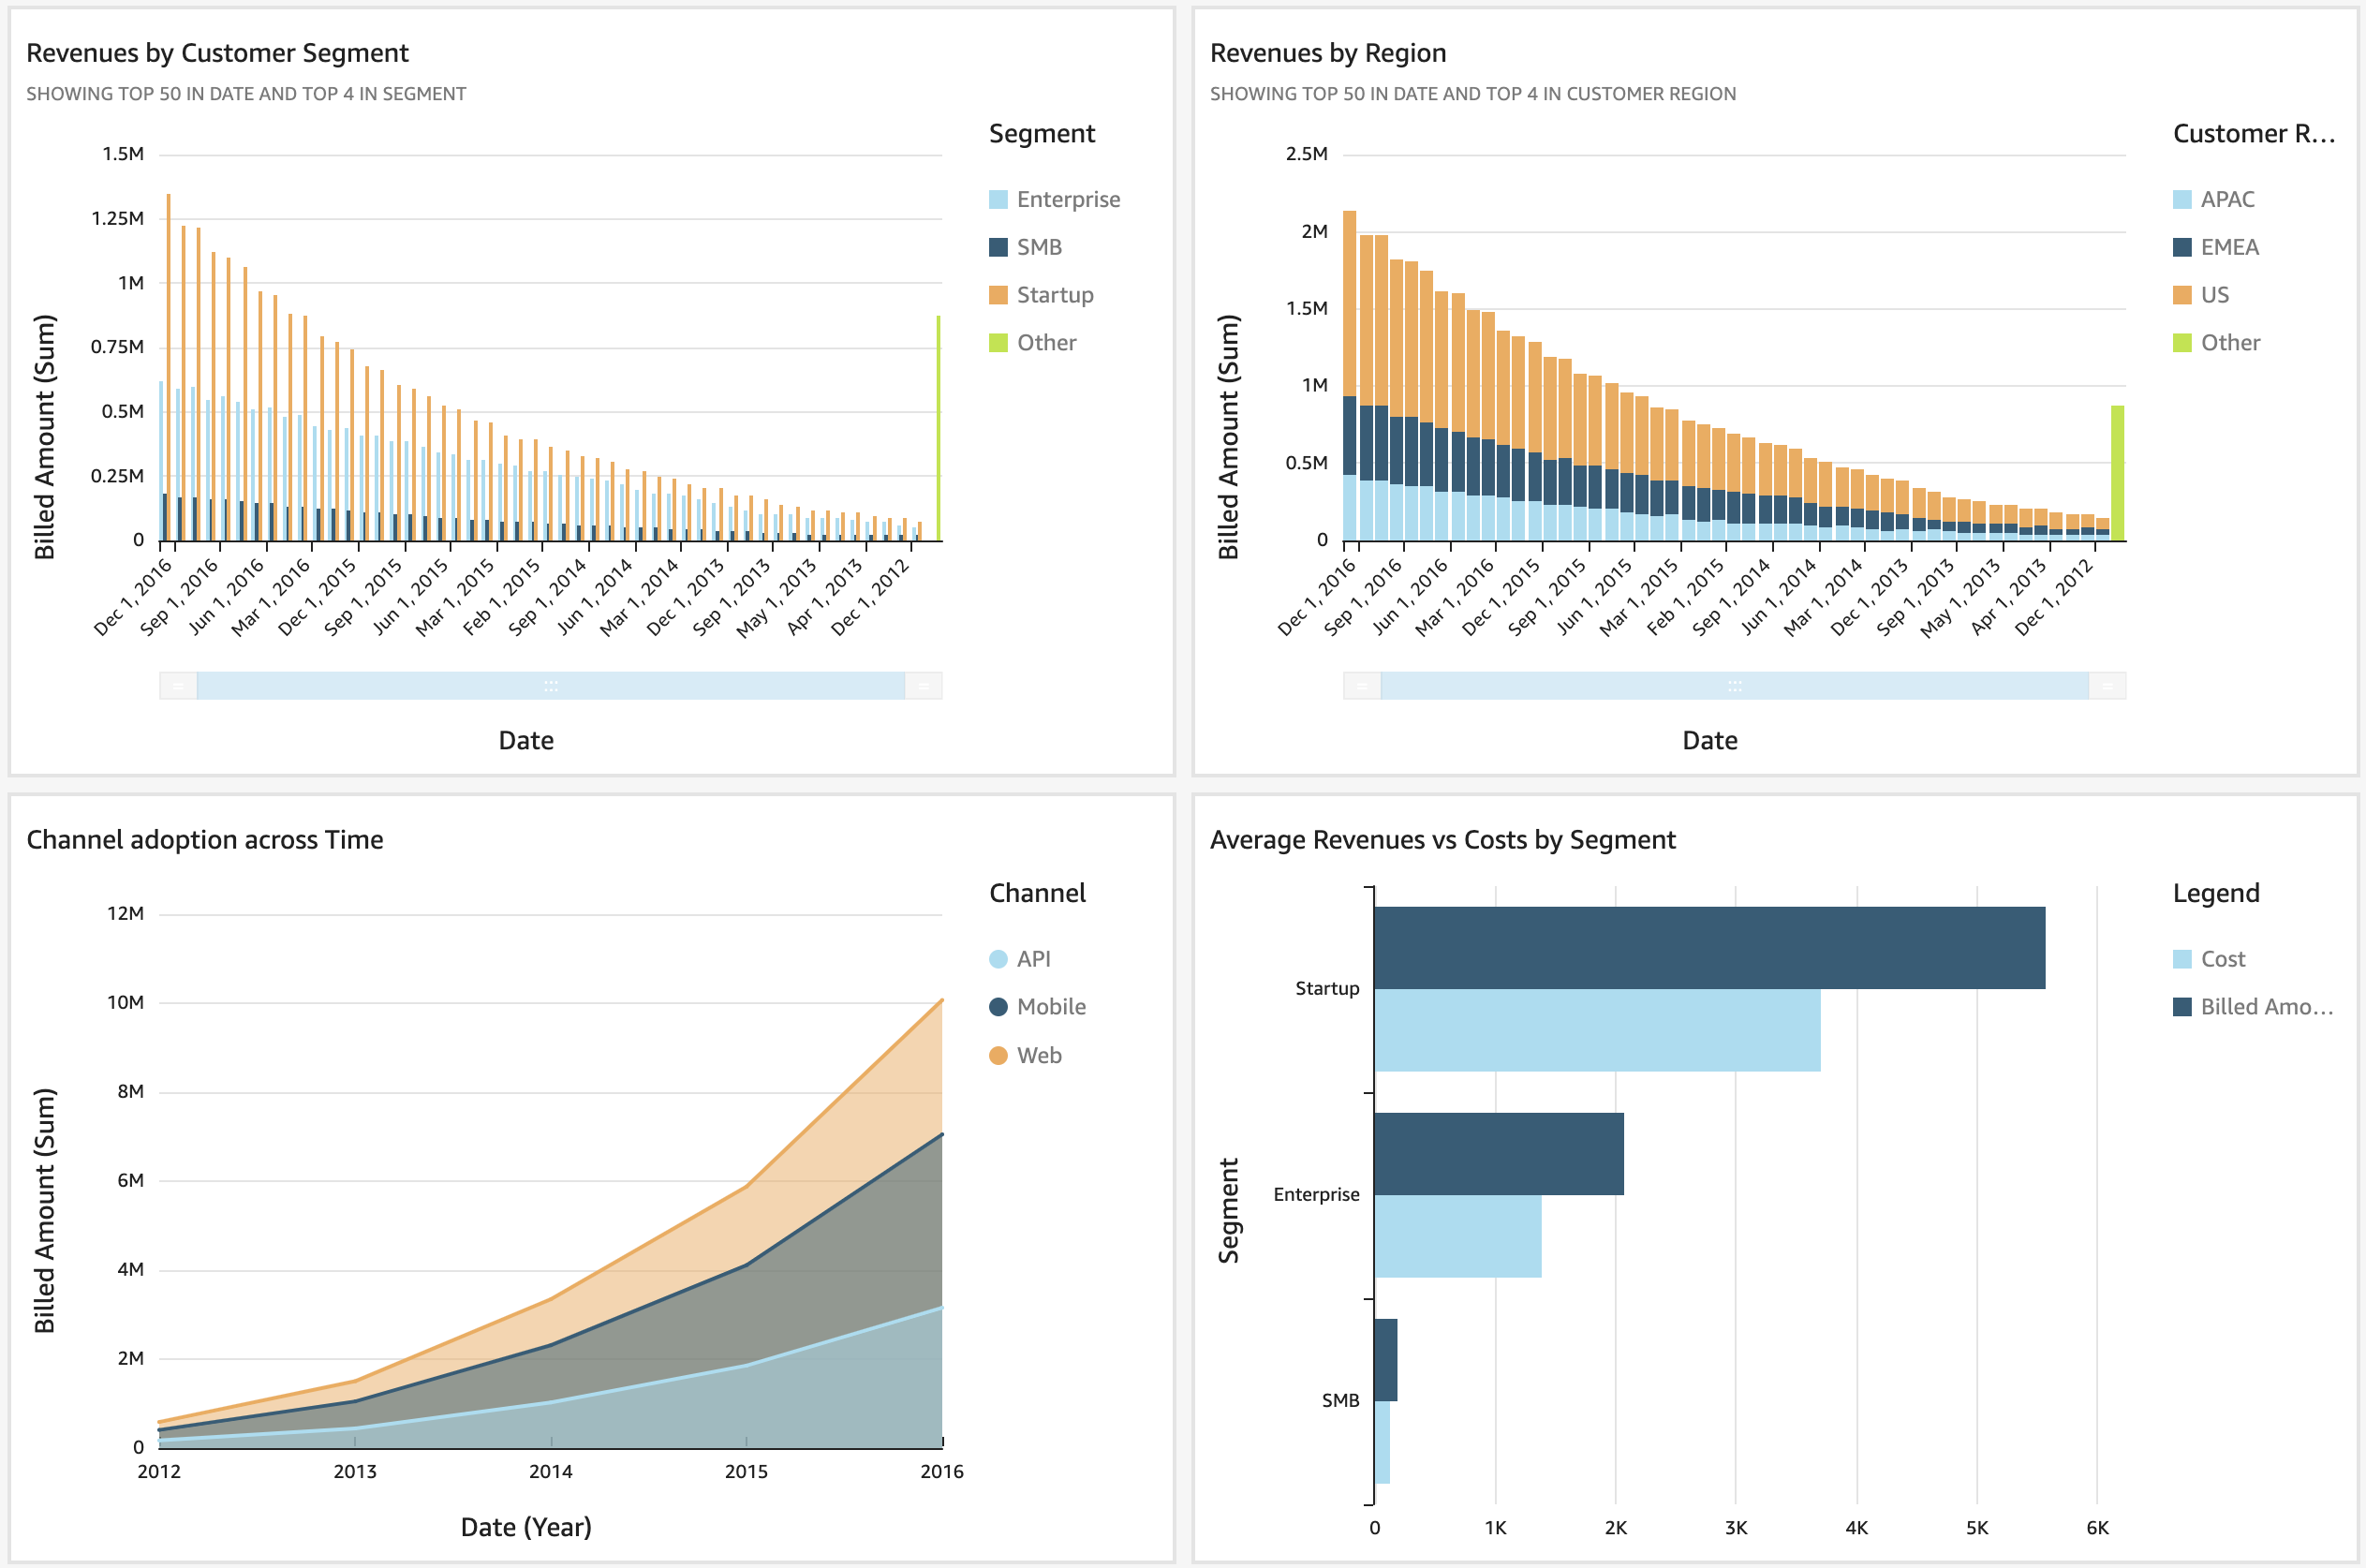
Analysis and Visualization
Analysis and visualization involves the creation of visuals, which are graphical representations of data.
After creating a dataset, you can analyze and visualize the data. The following is an example.
- Bar graph
- Line chart
- Pie charts
- Heat maps
- Pivot tables
- Tree Maps
- Point Maps
Some types of Visuals have creation requirements. For example, to create a point map, geospatial data must be included in the dataset. There is also a Visual type called AutoGraph, and if you select this Visual type, QuickSight will automatically select the best Visual type based on the numbers and types of the graph axes.
Visuals can be customized in a variety of ways, including changing the text and background colors, adding filter functions, and drill-down functions.
Publish analysis as a dashboard
The completed Visual can be published to a dashboard so that other users can view and filter the data in the dashboard on QuickSight. You can also embed the dashboard on the web as HTML as shown below.
<iframe
  width="960"
  height="720"
  src="https://ap-northeast-1.quicksight.aws.amazon.com/sn/embed/share/accounts/1234567890412/dashboards/123c4ac7-1135-4a72-ba6e-e2e17a133333?directory_alias=demo"
>
</iframe>
Add a calculated field to a dataset
QuickSight allows you to add calculated fields to a dataset. For example, if you have purchase data with columns "Price" and "Number Purchased", you can perform a calculation of Price * Number Purchased and add a "Total Amount" field.
Integrate with SageMaker model
If your license is Enterprize Edition and you can perform inference with SageMaker models on data stored in SPICE, you can refer to the following article for a look at the integration with SageMaker.
Updating datasets
Datasets can be updated manually (console, CLI) or by scheduling. You can also choose between full or incremental refresh methods.
QuickSight Q
QuickSight Q is a Natural Language Query (NLQ) function that allows you to ask questions about data in everyday language and get answers to those questions in the form of numbers, graphs, and tables. For example, if you ask a question such as, "How have your sales changed over the last three years?" the natural language processing of the question will be performed and the results of the Visualized question will be returned. QuickSight Q was released to the public on September 23, 2021.
References


Ryusei Kakujo


Weave the future of cities through data
Transportation modeling/ Urban planning/ Machine learning/ Computer science/ GIS