


What is Permutation Importance
Permutation Importance is a technique used in the field of machine learning to understand the relevance of features in a predictive model. By estimating the impact of each feature on a model's performance, it helps data scientists identify the most important features and make informed decisions when building and refining their models.
Methodology for Calculating Permutation Importance
In mathematics, a permutation is an arrangement of objects in a specific order. In the context of Permutation Importance, permutations refer to the process of randomly shuffling the values of a feature within the dataset while keeping the other features unchanged. This shuffling process helps assess the impact of a feature on the model's performance, as the loss in accuracy or other metrics can be attributed to the perturbation of the feature's values.
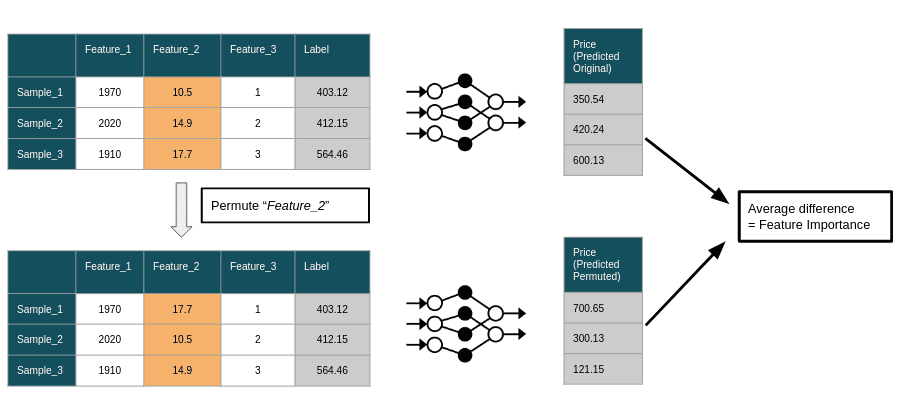
Calculating Permutation Importance involves several steps, which are outlined below:
-
Train the model
Fit the machine learning model to the original dataset using the chosen evaluation metric and loss function. -
Evaluate baseline performance
Evaluate the model's performance on the original dataset and record the baseline metric value. -
Permute a feature
Randomly shuffle the values of one feature in the dataset, keeping the other features unchanged. -
Re-evaluate performance
Evaluate the model's performance on the perturbed dataset, and calculate the difference in metric values between the perturbed and original dataset. -
Repeat steps 3-4
Shuffle and evaluate each feature in the dataset, recording the change in performance for each permutation. -
Calculate importance scores
Average the change in performance across multiple iterations for each feature. -
Rank features
Sort the features based on their importance scores in descending order.
Handling Categorical Variables
Permutation Importance can be extended to categorical variables by performing permutations within each category. This preserves the categorical structure while still allowing for an assessment of the variable's importance. However, care should be taken when interpreting the results, as the importance scores may be influenced by the number of categories and their distribution within the dataset.
Visualizing Permutation Importance in Python
In this chapter, I will demonstrate how to visualize Permutation Importance using the California Housing dataset.
The California Housing dataset contains information about the housing market in California, including features like median income, median house age, and average number of rooms per house. The target variable is the median house value.
First, let's load the dataset and split it into training and testing sets:
from sklearn.datasets import fetch_california_housing
from sklearn.model_selection import train_test_split

data = fetch_california_housing()
X, y = data.data, data.target
X_train, X_test, y_train, y_test = train_test_split(X, y, test_size=0.2, random_state=42)
For this example, we will train a random forest regressor:
from sklearn.ensemble import RandomForestRegressor

model = RandomForestRegressor(n_estimators=100, random_state=42)
model.fit(X_train, y_train)
We can use the permutation_importance function from the sklearn to calculate Permutation Importance for the features:
from sklearn.inspection import permutation_importance

result = permutation_importance(model, X_test, y_test, n_repeats=10, random_state=42)
The n_repeats parameter in the permutation_importance function determines the number of times the permutation process is repeated for each feature in the dataset.
We can create a bar plot to visualize the Permutation Importance of each feature using matplotlib and seaborn:
import numpy as np
import matplotlib.pyplot as plt
import seaborn as sns

# Sort the features by importance
sorted_idx = result.importances_mean.argsort()

# Create a horizontal bar plot
plt.figure(figsize=(10, 6))
sns.barplot(x=result.importances_mean[sorted_idx], y=np.array(data.feature_names)[sorted_idx], palette='viridis')

# Add error bars to show the standard deviation of the importance scores
plt.errorbar(x=result.importances_mean[sorted_idx], y=np.arange(len(sorted_idx)),
             xerr=result.importances_std[sorted_idx], fmt='o', capsize=5, color='black')

# Set the plot title and labels
plt.title('Permutation Importance of Features')
plt.xlabel('Importance Score')
plt.ylabel('Feature')
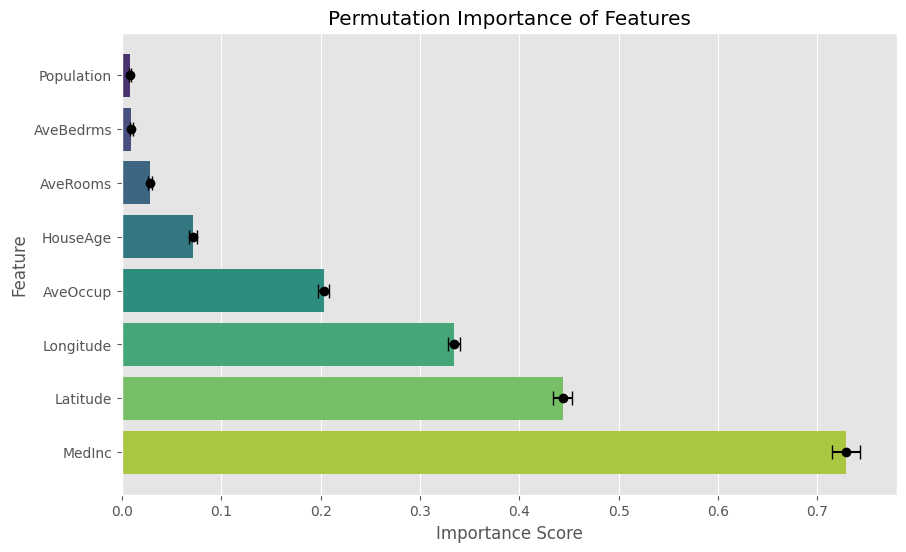
This visualization clearly displays the Permutation Importance scores for each feature in the California Housing dataset, along with their standard deviations. By inspecting the plot, we can see that MedInc (median income) is the most important feature.
References


Ryusei Kakujo


Weave the future of cities through data
Transportation modeling/ Urban planning/ Machine learning/ Computer science/ GIS