What is Cross Validation
Cross validation is a technique used in machine learning and statistical modeling to evaluate the performance of a predictive model on an independent dataset. The process involves partitioning a dataset into two subsets: a training set, which is used to train the model, and a validation set, which is used to test the performance of the model.
The goal of cross validation is to assess how well a model is able to generalize to new data that it has not seen before. By using a validation set that is separate from the training set, cross validation helps to prevent overfitting, which occurs when a model is too complex and performs well on the training data but poorly on new, unseen data.
Why is Cross Validation Important
Cross validation is an important technique in machine learning and statistical modeling for several reasons:
-
Accurate Model Selection
Cross validation helps to select the best model from a set of candidate models by estimating how well each model will perform on new, unseen data. This is important because a model that performs well on the training data but poorly on new data is not useful in practice. -
Robustness and Generalization
Cross validation helps to ensure that a model is robust and able to generalize to new data by preventing overfitting. Overfitting occurs when a model is too complex and fits the noise in the training data, resulting in poor performance on new data. -
Identifying Overfitting
Cross validation helps to identify when a model is overfitting by estimating the variance and bias of the model. This information can be used to adjust the complexity of the model and improve its performance. -
Avoiding Data Leakage
Cross validation helps to avoid data leakage, which occurs when information from the validation set is used in the training process. Data leakage can lead to overestimation of model performance and inaccurate results.
Here's a real world example:
Suppose we are building a machine learning model to predict whether a customer is likely to churn or not based on their purchase history, demographics, and other factors. We have a dataset with 10,000 customers, of which 1,000 have churned.
If we simply split the dataset into training and testing sets randomly, we might end up with a testing set that contains very few churned customers, resulting in inaccurate performance metrics. For example, if our testing set only contains 5% churned customers, a model that simply predicts that no one will churn would still have an accuracy of 95%, even though it is not useful in practice.
By using cross validation, we can ensure that the ratio of churned customers is consistent across all folds, and that the performance metrics are more accurate and reliable. For example, we might use stratified k-fold cross validation with 5 folds, ensuring that each fold contains the same proportion of churned customers.
Furthermore, by using cross validation we can identify potential issues with overfitting or underfitting, and adjust the model accordingly. For example, if we find that the model performs well on the training set but poorly on the testing set, we may need to reduce the complexity of the model or add regularization to prevent overfitting.
Types of Cross Validation
There are several types of cross validation techniques that are commonly used in machine learning and statistical modeling.
Holdout Method
The holdout method is a type of cross validation that involves splitting the dataset into two subsets, one for training the model and another for testing the model. The holdout method is simple and easy to implement, but it may not be as reliable as other cross validation techniques such as k-fold cross validation.
Here's an example Python code for implementing the holdout method using the scikit-learn library:
from sklearn.datasets import load_iris
from sklearn.model_selection import train_test_split
from sklearn.neighbors import KNeighborsClassifier

# Load the iris dataset
iris = load_iris()

# Split the dataset into training and testing sets
X_train, X_test, y_train, y_test = train_test_split(iris.data, iris.target, test_size=0.3)

# Train a k-nearest neighbors classifier on the training set
knn = KNeighborsClassifier(n_neighbors=5)
knn.fit(X_train, y_train)

# Evaluate the performance of the classifier on the testing set
score = knn.score(X_test, y_test)
print('Accuracy:', score)
In this example, we load the iris dataset using the load_iris() function from scikit-learn. We then split the dataset into training and testing sets using the train_test_split() function, with a test size of 0.3 (30% of the data is used for testing).
Next, we train a k-nearest neighbors classifier on the training set using the KNeighborsClassifier() function from scikit-learn. Finally, we evaluate the performance of the classifier on the testing set using the score() method, which returns the accuracy of the classifier on the testing set.
Leave-One-Out Cross Validation
Leave-One-Out Cross Validation (LOOCV) is a type of cross validation where the number of folds is equal to the number of samples in the dataset. In LOOCV, the model is trained on all samples except one, which is used for testing. This process is repeated for each sample in the dataset, and the performance metrics are averaged over all folds to evaluate the model's performance.
Here's an example Python code for implementing LOOCV using the scikit-learn library:
from sklearn.datasets import load_iris
from sklearn.model_selection import LeaveOneOut
from sklearn.neighbors import KNeighborsClassifier

# Load the iris dataset
iris = load_iris()

# Initialize the LOOCV iterator
loo = LeaveOneOut()

# Train and test the model on each sample
scores = []
for train_idx, test_idx in loo.split(iris.data):
    # Get the training and testing data for this sample
    X_train, y_train = iris.data[train_idx], iris.target[train_idx]
    X_test, y_test = iris.data[test_idx], iris.target[test_idx]

    # Train a k-nearest neighbors classifier on the training set
    knn = KNeighborsClassifier(n_neighbors=5)
    knn.fit(X_train, y_train)

    # Evaluate the performance of the classifier on the testing set
    score = knn.score(X_test, y_test)
    scores.append(score)

# Calculate the average performance metric over all samples
accuracy = sum(scores) / len(scores)
print('Accuracy:', accuracy)
In this example, we load the iris dataset using the load_iris() function from scikit-learn. We then initialize the LOOCV iterator using the LeaveOneOut() function.
Next, we loop through each sample in the dataset and train and test the model on the corresponding training and testing data. We use the split() method of the LOOCV iterator to get the indices of the training and testing data for each sample.
We then train a k-nearest neighbors classifier on the training set and evaluate its performance on the testing set using the score() method. We append the performance metric to a list of scores.
Finally, we calculate the average performance metric over all samples by summing up the scores and dividing by the number of samples in the dataset.
K-fold Cross Validation
K-fold cross validation is a widely used technique for cross validation in machine learning. In K-fold cross validation, the dataset is divided into K equal-sized folds, and the model is trained and tested K times, each time using a different fold for testing and the remaining K-1 folds for training. This helps to ensure that the model is trained and tested on all parts of the dataset, and that the performance metrics are more accurate and reliable.
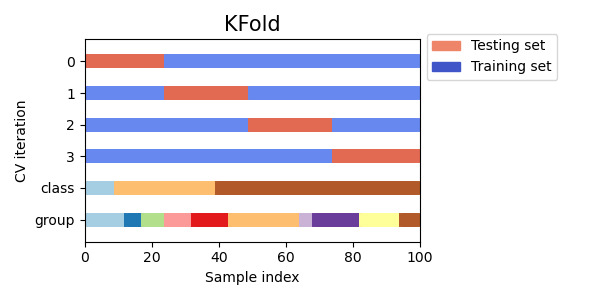
Visualizing cross-validation behavior in scikit-learn
from sklearn.datasets import load_iris
from sklearn.model_selection import KFold
from sklearn.neighbors import KNeighborsClassifier

# Load the iris dataset
iris = load_iris()

# Define the number of folds for K-fold cross validation
num_folds = 5

# Initialize the K-fold cross validation iterator
kf = KFold(n_splits=num_folds, shuffle=True)

# Train and test the model on each fold
for fold, (train_idx, test_idx) in enumerate(kf.split(iris.data)):
    # Get the training and testing data for this fold
    X_train, y_train = iris.data[train_idx], iris.target[train_idx]
    X_test, y_test = iris.data[test_idx], iris.target[test_idx]

    # Train a k-nearest neighbors classifier on the training set
    knn = KNeighborsClassifier(n_neighbors=5)
    knn.fit(X_train, y_train)

    # Evaluate the performance of the classifier on the testing set
    score = knn.score(X_test, y_test)
    print('Fold:', fold, 'Accuracy:', score)
Group K-fold Cross Validation
Group K-fold cross validation is a variant of K-fold cross validation that ensures that data samples from the same group are not present in both the training and testing sets. This can be useful when the data is divided into groups that are related, such as when working with medical data from different patients or financial data from different companies.
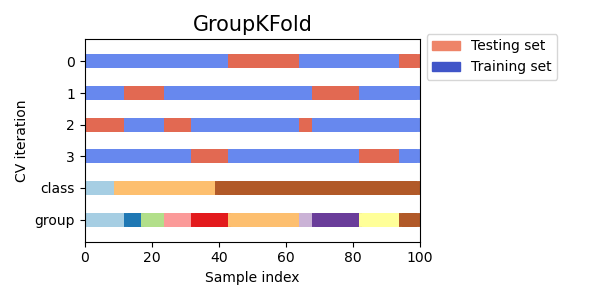
Visualizing cross-validation behavior in scikit-learn
from sklearn.model_selection import GroupKFold
from sklearn.datasets import make_classification
from sklearn.linear_model import LogisticRegression

# Generate example data with 3 groups
X, y = make_classification(n_samples=100, n_features=10, n_informative=5, n_redundant=0, n_classes=2, random_state=42)
groups = [0, 0, 0, 1, 1, 1, 2, 2, 2, 2]

# Create Group K-fold object with 3 folds
gkf = GroupKFold(n_splits=3)

# Iterate over splits and train/test the model
for train_index, test_index in gkf.split(X, y, groups=groups):
    X_train, X_test = X[train_index], X[test_index]
    y_train, y_test = y[train_index], y[test_index]

    # Fit model on training data
    model = LogisticRegression().fit(X_train, y_train)

    # Evaluate model on testing data
    score = model.score(X_test, y_test)
    print("Accuracy score: ", score)
Shuffle Split Cross Validation
Shuffle Split cross validation is a method that randomly splits the data into training and testing sets multiple times, allowing for more control over the size of the training and testing sets than other cross validation methods.
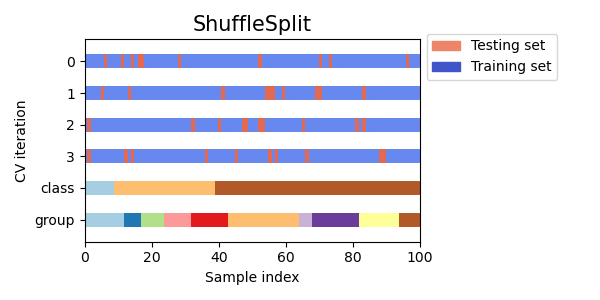
Visualizing cross-validation behavior in scikit-learn
from sklearn.model_selection import ShuffleSplit
from sklearn.datasets import make_classification
from sklearn.linear_model import LogisticRegression

# Generate example data
X, y = make_classification(n_samples=100, n_features=10, n_informative=5, n_redundant=0, n_classes=2, random_state=42)

# Create Shuffle Split object with 5 splits and a 0.5 test size
ss = ShuffleSplit(n_splits=5, test_size=0.5)

# Iterate over splits and train/test the model
for train_index, test_index in ss.split(X, y):
    X_train, X_test = X[train_index], X[test_index]
    y_train, y_test = y[train_index], y[test_index]

    # Fit model on training data
    model = LogisticRegression().fit(X_train, y_train)

    # Evaluate model on testing data
    score = model.score(X_test, y_test)
    print("Accuracy score: ", score)
Stratified K-fold Cross Validation
Stratified k-fold cross validation is a method that partitions the data into k folds, but ensures that each fold has roughly the same proportion of samples from each class as the entire dataset. This is particularly useful when dealing with imbalanced datasets, where one class may be much more prevalent than the others.
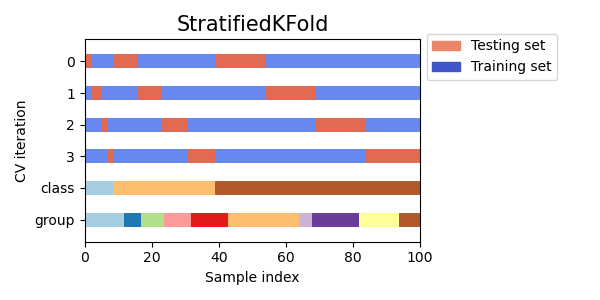
Visualizing cross-validation behavior in scikit-learn
from sklearn.model_selection import StratifiedKFold
from sklearn.datasets import make_classification
from sklearn.linear_model import LogisticRegression

# Generate example data
X, y = make_classification(n_samples=100, n_features=10, n_informative=5, n_redundant=0, n_classes=2, random_state=42)

# Create Stratified K-fold object with 5 splits
skf = StratifiedKFold(n_splits=5)

# Iterate over splits and train/test the model
for train_index, test_index in skf.split(X, y):
    X_train, X_test = X[train_index], X[test_index]
    y_train, y_test = y[train_index], y[test_index]

    # Fit model on training data
    model = LogisticRegression().fit(X_train, y_train)

    # Evaluate model on testing data
    score = model.score(X_test, y_test)
    print("Accuracy score: ", score)
Stratified Group K-fold Cross Validation
Stratified group k-fold cross validation is a variation of k-fold cross validation that takes into account groups in addition to the class labels. It partitions the data into k folds, ensuring that each fold has roughly the same proportion of samples from each class as well as the same proportion of samples from each group.
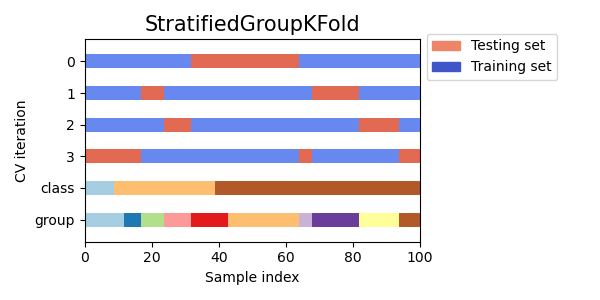
Visualizing cross-validation behavior in scikit-learn
from sklearn.model_selection import GroupKFold, StratifiedKFold
from sklearn.datasets import make_classification
from sklearn.linear_model import LogisticRegression

# Generate example data with group labels
X, y = make_classification(n_samples=100, n_features=10, n_informative=5, n_redundant=0, n_classes=2, random_state=42)
groups = [i % 5 for i in range(len(X))] # Assign groups based on remainder of index

# Create Stratified Group K-fold object with 5 splits
skf = StratifiedKFold(n_splits=5)
sgkf = [(train_index, test_index) for train_index, test_index in skf.split(X, y)]

# Use Group K-fold to ensure each fold has the same groups as in the entire dataset
sgkf = [(train_index, test_index) for train_index, test_index in GroupKFold(n_splits=5).split(X, y, groups=groups)]

# Iterate over splits and train/test the model
for train_index, test_index in sgkf:
    X_train, X_test = X[train_index], X[test_index]
    y_train, y_test = y[train_index], y[test_index]

    # Fit model on training data
    model = LogisticRegression().fit(X_train, y_train)

    # Evaluate model on testing data
    score = model.score(X_test, y_test)
    print("Accuracy score: ", score)
Group Shuffle Split Cross Validation
Group shuffle split cross validation is a variation of cross validation that takes into account the groups in addition to the class labels and shuffles the data randomly before splitting it into training and testing sets. This can be useful when dealing with imbalanced datasets or when the order of the data points matters, such as in time series data.
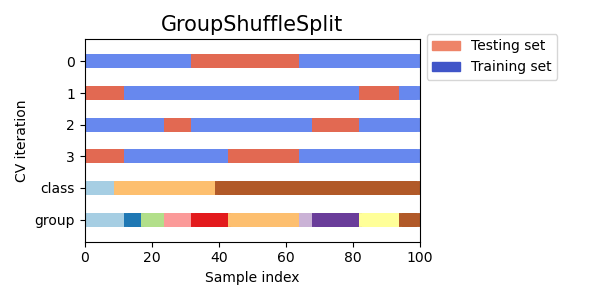
Visualizing cross-validation behavior in scikit-learn
from sklearn.model_selection import GroupShuffleSplit
from sklearn.datasets import make_classification
from sklearn.linear_model import LogisticRegression

# Generate example data with group labels
X, y = make_classification(n_samples=100, n_features=10, n_informative=5, n_redundant=0, n_classes=2, random_state=42)
groups = [i % 5 for i in range(len(X))] # Assign groups based on remainder of index

# Create Group Shuffle Split object with 80/20 split
gss = GroupShuffleSplit(n_splits=5, test_size=0.2)

# Iterate over splits and train/test the model
for train_index, test_index in gss.split(X, y, groups=groups):
    X_train, X_test = X[train_index], X[test_index]
    y_train, y_test = y[train_index], y[test_index]

    # Fit model on training data
    model = LogisticRegression().fit(X_train, y_train)

    # Evaluate model on testing data
    score = model.score(X_test, y_test)
    print("Accuracy score: ", score)
Stratified Shuffle Split Cross Validation
Stratified shuffle split cross validation is a variation of cross validation that combines stratification and shuffling. Stratification ensures that the class proportions are preserved in each split, while shuffling randomizes the order of the samples. This technique can be useful for imbalanced datasets or when the order of the data points is important.
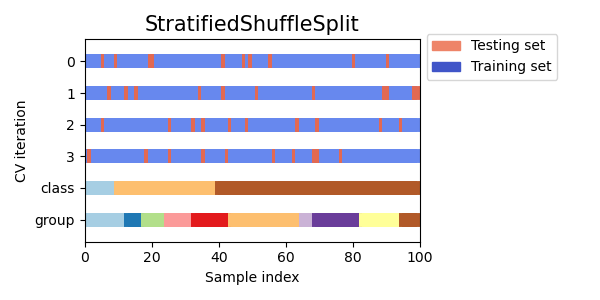
Visualizing cross-validation behavior in scikit-learn
from sklearn.model_selection import StratifiedShuffleSplit
from sklearn.datasets import make_classification
from sklearn.linear_model import LogisticRegression

# Generate example data with two classes
X, y = make_classification(n_samples=100, n_features=10, n_informative=5, n_redundant=0, n_classes=2, random_state=42)

# Create Stratified Shuffle Split object with 80/20 split
sss = StratifiedShuffleSplit(n_splits=5, test_size=0.2, random_state=42)

# Iterate over splits and train/test the model
for train_index, test_index in sss.split(X, y):
    X_train, X_test = X[train_index], X[test_index]
    y_train, y_test = y[train_index], y[test_index]

    # Fit model on training data
    model = LogisticRegression().fit(X_train, y_train)

    # Evaluate model on testing data
    score = model.score(X_test, y_test)
    print("Accuracy score: ", score)
Time Series Cross Validation
Time Series Cross Validation is a type of cross validation used for time series data, where the goal is to predict future values based on past observations. In this method, the training set consists of past observations and the testing set consists of future observations.
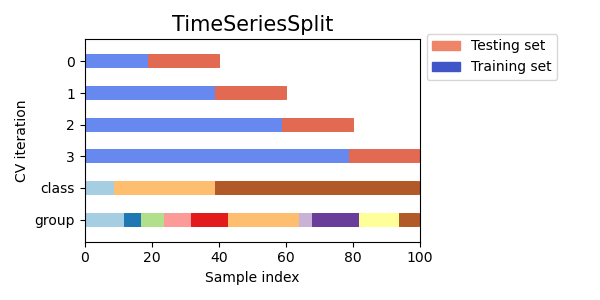
Visualizing cross-validation behavior in scikit-learn

Forecasting at Uber: An Introduction
import pandas as pd
from sklearn.model_selection import TimeSeriesSplit
from sklearn.linear_model import LinearRegression

# Load the dataset
data = pd.read_csv('time_series_data.csv')

# Set the target variable
target_variable = 'sales'

# Set the number of splits
n_splits = 5

# Initialize the TimeSeriesSplit iterator
tscv = TimeSeriesSplit(n_splits=n_splits)

# Train and test the model on each split
scores = []
for train_index, test_index in tscv.split(data):
    # Get the training and testing data for this split
    train_data = data.iloc[train_index]
    test_data = data.iloc[test_index]

    # Separate the target variable from the features
    X_train = train_data.drop(columns=[target_variable])
    y_train = train_data[target_variable]
    X_test = test_data.drop(columns=[target_variable])
    y_test = test_data[target_variable]

    # Train a linear regression model on the training set
    model = LinearRegression()
    model.fit(X_train, y_train)

    # Evaluate the performance of the model on the testing set
    score = model.score(X_test, y_test)
    scores.append(score)

# Calculate the average performance metric over all splits
accuracy = sum(scores) / len(scores)
print('Accuracy:', accuracy)
In this example, we load the time series data from a CSV file using the read_csv() function from Pandas. We then set the target variable, which in this case is 'sales'. We also set the number of splits to 5.
Next, we initialize the TimeSeriesSplit iterator using the TimeSeriesSplit() function from scikit-learn. We loop through each split in the iterator and train and test the model on the corresponding training and testing data.
For each split, we separate the target variable from the features and train a linear regression model on the training set. We evaluate the performance of the model on the testing set using the score() method, which calculates the coefficient of determination (
Finally, we calculate the average performance metric over all splits by summing up the scores and dividing by the number of splits. This gives us an estimate of the model's performance on future data. Time Series Cross Validation is particularly useful for evaluating the performance of models on time series data, where the goal is to make accurate predictions of future values based on past observations.
Sliding Window Cross Validation
Sliding window cross validation is a type of time series cross validation where the testing set consists of a fixed-size window that slides over the entire time series data. This approach can be useful for evaluating the performance of time series models on data that evolves over time.
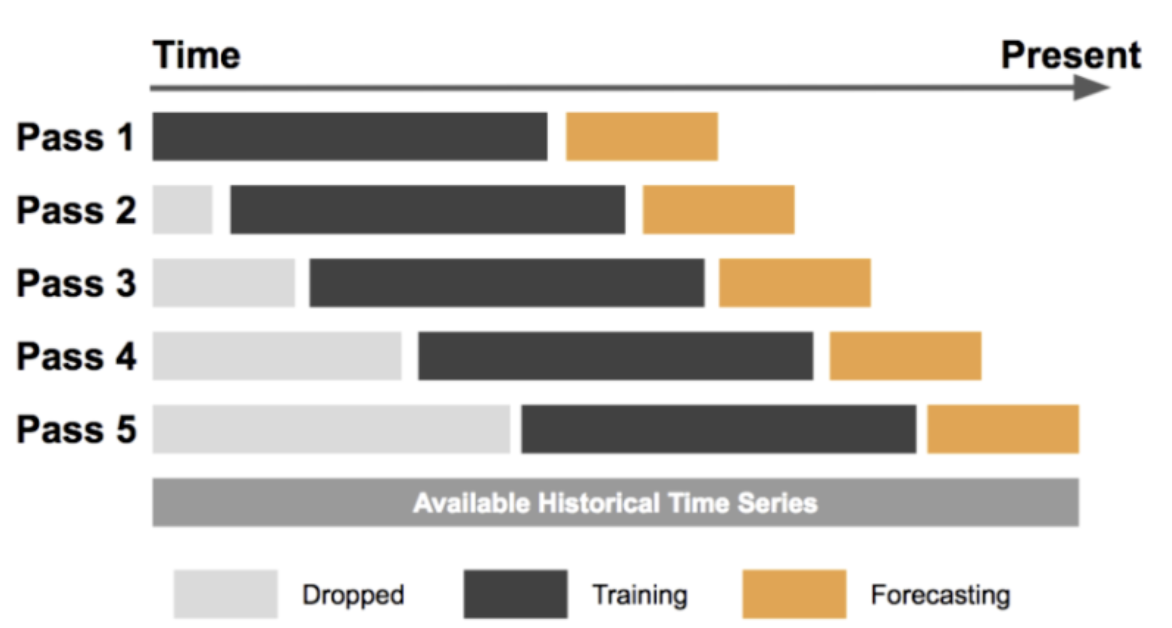
Forecasting at Uber: An Introduction
import numpy as np
from sklearn.model_selection import TimeSeriesSplit
from sklearn.linear_model import LinearRegression

# Generate example time series data
data = np.random.rand(100)

# Specify window size
window_size = 10

# Create sliding window iterator
tscv = TimeSeriesSplit(n_splits=len(data)-window_size+1)

# Iterate over sliding windows and train/test the model
for train_index, test_index in tscv.split(data):
    X_train, X_test = data[train_index], data[test_index]
    y_train, y_test = data[train_index+window_size], data[test_index+window_size]

    # Fit model on training data
    model = LinearRegression().fit(X_train.reshape(-1, 1), y_train.reshape(-1, 1))

    # Evaluate model on testing data
    score = model.score(X_test.reshape(-1, 1), y_test.reshape(-1, 1))
    print("R-squared score: ", score)
In this example, we generate a random time series data of length 100, and set the window size to 10. We then create a TimeSeriesSplit object with the number of splits equal to the number of possible sliding windows. We then iterate over each sliding window using the split method, and split the data into training and testing sets. We then train a linear regression model on the training data, and evaluate its performance on the testing data using the R-squared score. Finally, we print the score for each sliding window.
Sliding window cross validation can be a useful technique for evaluating the performance of time series models on data that evolves over time. By sliding a fixed-size window over the entire time series data, we can train and test the model on different time periods and obtain a robust estimate of its performance.
Which Types of Cross Validation Should We Choose
Choosing the best type of cross validation for a given problem depends on several factors, such as the size and complexity of the dataset, the type of model being trained, and the specific goals of the analysis. Here are some examples of how to choose the best type of cross validation for different real-world scenarios:
-
Small dataset with limited samples
In this scenario, leave-one-out cross validation may be the best option, as it maximizes the use of the available data and provides a robust estimate of model performance. This could be useful for medical studies with limited sample sizes, where every data point is valuable. -
Large dataset with complex models
In this scenario, k-fold cross validation may be a good choice, as it balances the tradeoff between computational efficiency and accuracy. For example, in a natural language processing task where the model has a large number of features, k-fold cross validation can help evaluate the performance of the model on different subsets of the data. -
Time series data
Time series cross validation is the best option for time-dependent data, as it accounts for the temporal structure of the data. For instance, in finance, when predicting stock prices, it is important to use time series cross validation to ensure the model is evaluated on data that is temporally independent of the training data. -
Imbalanced dataset
In a classification task with imbalanced data, stratified cross validation may be the best option, as it ensures that each fold contains a representative sample of both positive and negative samples. For example, in medical diagnosis, a disease may be rare, but it is still important to correctly identify positive cases, so stratified cross validation is important to ensure that the model is not biased towards the majority class.
In summary, choosing the best type of cross validation depends on the specific characteristics of the dataset and the goals of the analysis. By considering the size, complexity, and nature of the data, and selecting the appropriate type of cross validation, we can obtain reliable estimates of model performance and avoid common pitfalls.
References