


What is K-Means Clustering
K-Means clustering is an unsupervised machine learning technique that is widely used for partitioning a dataset into K distinct clusters. The algorithm aims to assign each data point to a cluster in a way that minimizes the within-cluster variation and maximizes the between-cluster variation. In essence, it seeks to group similar data points together based on their feature values.
K-Means Algorithm
Objective Function
The K-Means algorithm aims to minimize the total within-cluster sum of squares, also known as the objective function or cost function. Mathematically, the objective function is defined as:
Here,
K-Means Algorithm Steps
The K-Means algorithm consists of the following steps:
-
Initialization
SelectK -
Assignment
Assign each data point to the nearest centroid. The distance between the data point and centroid is typically measured using the Euclidean distance, but other distance metrics can also be used. -
Update
Calculate the new centroids by taking the mean of all data points assigned to each centroid's cluster. -
Convergence
Repeat steps 2 and 3 until the centroids' positions do not change significantly, or a predefined number of iterations have been reached.
The algorithm is sensitive to the initial centroids' placement, and different initializations can lead to different final cluster assignments. To mitigate this issue, the algorithm is often run multiple times with different initializations, and the final clustering result is selected based on the lowest objective function value.
Choosing the Right Number of Clusters (K)
Selecting the appropriate number of clusters (K) is crucial for the performance of the K-Means algorithm. Choosing a small value for K may result in underfitting, while a large value may lead to overfitting. In this chapter, I will discuss three popular methods to determine the optimal K value: the Elbow Method, the Silhouette Method, and the Gap Statistic.
Elbow Method
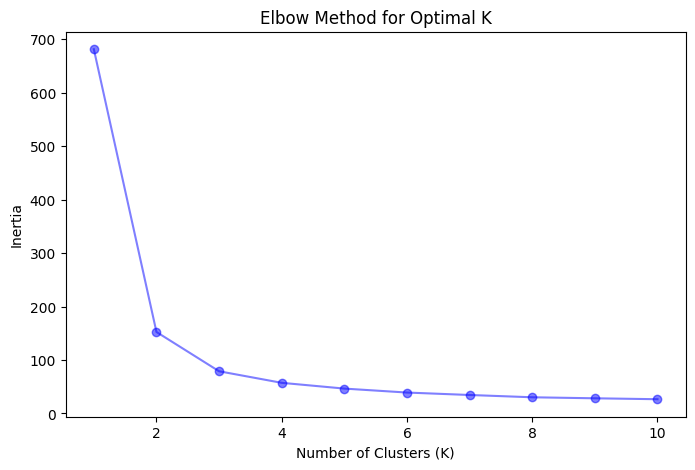
The Elbow Method is a heuristic technique that involves plotting the explained variation (inertia) as a function of the number of clusters (K) and identifying the "elbow" point in the plot. The inertia is the sum of squared distances between each data point and its assigned centroid. As K increases, the inertia decreases, but the rate of decrease diminishes. The elbow point represents the value of K at which the inertia's decrease rate starts to slow down significantly, suggesting that adding more clusters does not provide substantial improvements.
Steps to apply the Elbow Method:
- Run the K-Means algorithm with different values of K, typically ranging from 1 to a predefined maximum value.
- Calculate the inertia for each value of K.
- Plot the inertia as a function of K.
- Identify the elbow point in the plot, which corresponds to the optimal value of K.
Silhouette Method
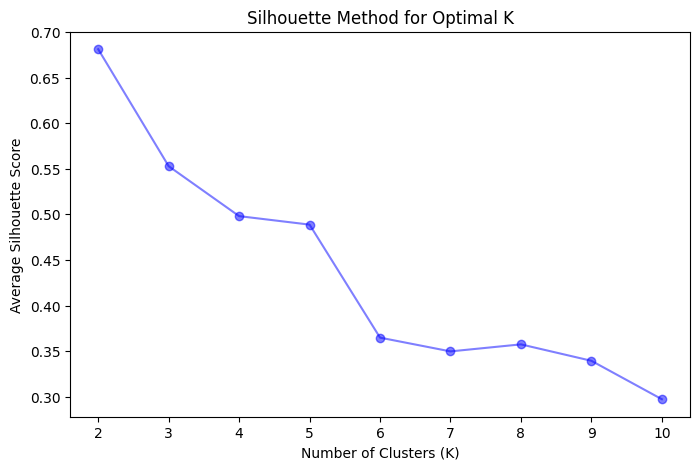
The Silhouette Method measures the quality of clustering by calculating the silhouette score for each data point. The silhouette score, ranging from -1 to 1, is a measure of how similar a data point is to its own cluster compared to other clusters.
A high silhouette score indicates that the data point is well-matched to its own cluster and poorly matched to other clusters. The average silhouette score for all data points provides an overall evaluation of the clustering quality.
Steps to apply the Silhouette Method:
- Run the K-Means algorithm with different values of K, typically ranging from 2 to a predefined maximum value.
- Calculate the silhouette score for each data point and compute the average silhouette score for each value of K.
- Plot the average silhouette score as a function of K.
- Identify the value of K that maximizes the average silhouette score.
Gap Statistic
The Gap Statistic is another technique used to estimate the optimal number of clusters (K). It compares the total within-cluster variation for different values of K with their expected values under a null reference distribution.
Steps to apply the Gap Statistic:
- Run the K-Means algorithm with different values of K, typically ranging from 1 to a predefined maximum value.
- Calculate the total within-cluster variation (inertia) for each value of K.
- Generate the null reference distribution by creating a random dataset with the same dimensions and range as the original dataset.
- Run the K-Means algorithm on the random dataset and calculate the total within-cluster variation (inertia) for each value of K.
- Compute the Gap Statistic for each K as the difference between the logarithm of the observed inertia and the logarithm of the expected inertia under the null reference distribution.
- Identify the value of K that maximizes the Gap Statistic.
Implementation of K-Means in Python
We will implement the K-Means clustering algorithm on the Iris dataset using Python and visualize the clustering results.
import numpy as np
import pandas as pd
import matplotlib.pyplot as plt
import seaborn as sns
from sklearn import datasets
from sklearn.cluster import KMeans
from sklearn.metrics import silhouette_score

# Load Iris dataset
iris = datasets.load_iris()
data = iris.data
feature_names = iris.feature_names

# Create a DataFrame
df = pd.DataFrame(data, columns=feature_names)

# Elbow Method to determine the optimal number of clusters (K)
inertias = []
K_range = range(1, 11)

for K in K_range:
    kmeans = KMeans(n_clusters=K, random_state=42)
    kmeans.fit(df)
    inertias.append(kmeans.inertia_)

plt.figure(figsize=(8, 5))
plt.plot(K_range, inertias, marker='o', color='blue', alpha=0.5)
plt.xlabel("Number of Clusters (K)")
plt.ylabel("Inertia")
plt.title("Elbow Method for Optimal K")
plt.show()

# Silhouette Method to determine the optimal number of clusters (K)
silhouette_scores = []

for K in range(2, 11):
    kmeans = KMeans(n_clusters=K, random_state=42)
    kmeans.fit(df)
    silhouette_scores.append(silhouette_score(df, kmeans.labels_))

plt.figure(figsize=(8, 5))
plt.plot(range(2, 11), silhouette_scores, marker='o', color='blue', alpha=0.5)
plt.xlabel("Number of Clusters (K)")
plt.ylabel("Average Silhouette Score")
plt.title("Silhouette Method for Optimal K")
plt.show()

# Based on the visualizations, choose the optimal K value
optimal_K = 3

# Perform K-Means clustering with the optimal K value
kmeans = KMeans(n_clusters=optimal_K, random_state=42)
kmeans.fit(df)
labels = kmeans.labels_
df['Cluster'] = labels

# Visualize the clustering result
plt.figure(figsize=(10, 6))
sns.scatterplot(x=df.iloc[:, 0], y=df.iloc[:, 1], hue=df['Cluster'], palette="deep", s=100)
plt.scatter(kmeans.cluster_centers_[:, 0], kmeans.cluster_centers_[:, 1], c='red', marker='x', label='Centroids', s=200)
plt.xlabel(feature_names[0])
plt.ylabel(feature_names[1])
plt.title("K-Means Clustering for Iris Dataset (K = 3)")
plt.legend()
plt.show()
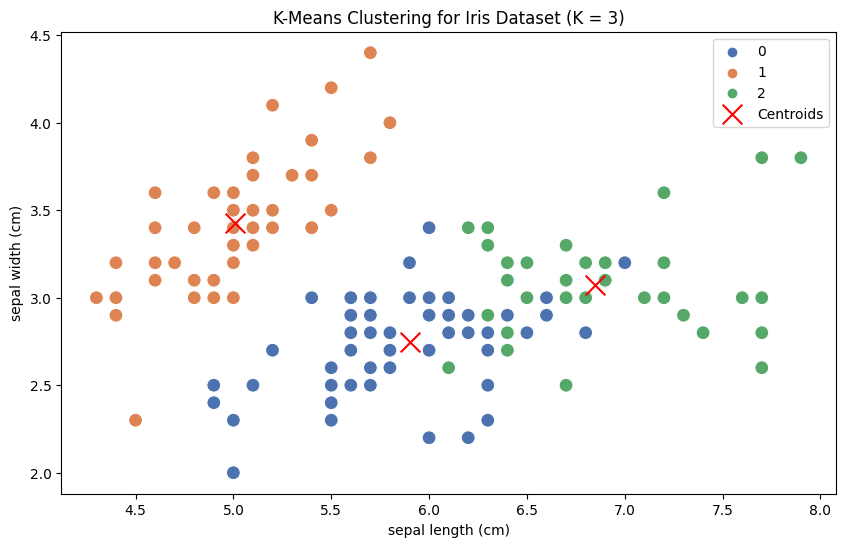
This code first loads the Iris dataset and converts it into a DataFrame. Then, it uses the Elbow Method and Silhouette Method to visualize the optimal number of clusters (K). Based on the visualizations, we choose
Finally, we perform K-Means clustering with the optimal K value and visualize the resulting clusters using a scatterplot, where different colors represent different clusters, and red 'x' markers represent the centroids of each cluster.
References


Ryusei Kakujo


Weave the future of cities through data
Transportation modeling/ Urban planning/ Machine learning/ Computer science/ GIS