


What is Hierarchical Clustering
Hierarchical clustering is a type of unsupervised machine learning algorithm that groups similar objects into clusters or subgroups based on their similarities and differences. The goal of hierarchical clustering is to create a hierarchy or tree-like structure of clusters, where the clusters at the lower levels of the tree are more similar to each other than those at the higher levels.
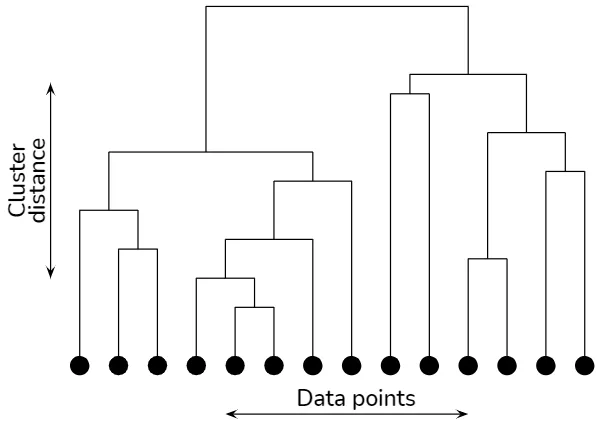
Dendrogram
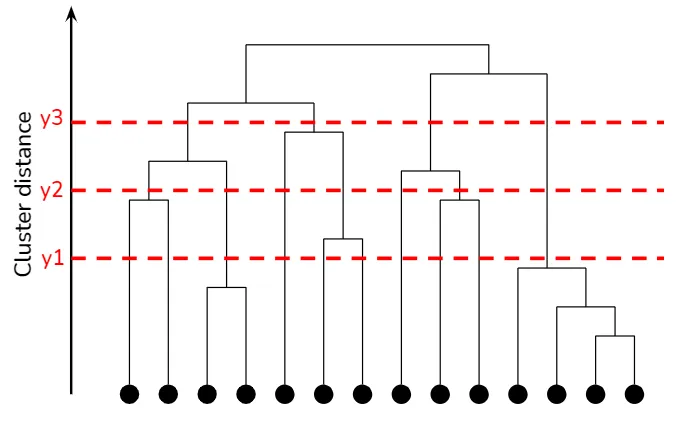
A dendrogram is a tree-like diagram that visualizes the hierarchical structure of clusters. In a dendrogram, each node represents a cluster, while the edges represent the distance or dissimilarity between clusters. The height of each edge indicates the degree of similarity between the clusters being merged or split. By examining a dendrogram, one can observe the clustering structure at various levels of granularity and determine the optimal number of clusters based on domain knowledge or other criteria.
Hierarchical clustering explained
Hierarchical clustering explained
Agglomerative vs. Divisive Approaches
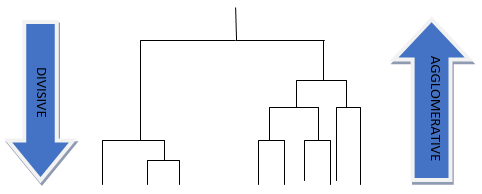
There are two main approaches to hierarchical clustering: agglomerative and divisive.
Agglomerative hierarchical clustering, also known as bottom-up clustering, starts by considering each data point as a singleton cluster. At each step, the two closest clusters are merged, and the process is repeated until all data points belong to a single cluster. The hierarchy is represented as a dendrogram, a tree-like diagram that illustrates the merges at different levels.
Divisive hierarchical clustering, or top-down clustering, begins with all data points in a single cluster. At each step, the largest or most heterogeneous cluster is split into two smaller clusters, and the process continues until each data point forms its own cluster. Divisive clustering also uses dendrograms to represent the cluster hierarchy.
Hierarchical Clustering Analysis
Agglomerative Hierarchical Clustering
Bottom-Up Approach
Agglomerative hierarchical clustering is a bottom-up approach that starts with individual data points as separate clusters and successively merges them into larger clusters. The algorithm iteratively combines the most similar or closest pairs of clusters until all data points belong to a single cluster. The result is a hierarchy of clusters represented by a dendrogram.
Linkage Methods
The process of merging clusters in agglomerative hierarchical clustering depends on the choice of linkage method. The linkage method defines the distance or similarity measure between clusters, which determines which clusters should be merged at each step. Some common linkage methods include:
Single Linkage
In single linkage, the distance between two clusters is defined as the minimum distance between any pair of data points from the two clusters. This method tends to produce elongated, chain-like clusters and is sensitive to noise and outliers.
Complete Linkage
Complete linkage defines the distance between two clusters as the maximum distance between any pair of data points from the two clusters. This method results in compact and well-separated clusters, but it is sensitive to the initial choice of clusters and may lead to over-segmentation.
Average Linkage
Average linkage calculates the distance between two clusters as the average distance between all pairs of data points from the two clusters. This method produces clusters with a balanced shape and size, and it is less sensitive to noise and outliers compared to single and complete linkage.
Centroid Linkage
Centroid linkage calculates the distance between two clusters as the distance between their centroids, which are the mean vectors of the data points in each cluster. This method produces clusters that are relatively compact and balanced in size. However, it may be affected by the "centroid shift phenomenon," where the centroids of the merged clusters may shift significantly, leading to potentially suboptimal clustering results.
Ward's Method
Ward's method minimizes the total within-cluster variance by merging clusters that result in the smallest increase in the sum of squared errors. This method tends to produce compact, spherical clusters and is suitable for data with a roughly equal cluster size.
Divisive Hierarchical Clustering
Top-Down Approach
Divisive hierarchical clustering is a top-down approach that starts with all data points in a single cluster and recursively splits the clusters into smaller ones. The algorithm identifies the largest or most heterogeneous cluster at each step and divides it into two subclusters based on a chosen bisection strategy. The process continues until each data point forms its own cluster. The result is a hierarchy of clusters represented by a dendrogram, similar to the agglomerative approach.
Bisection Strategies
The choice of bisection strategy in divisive hierarchical clustering determines how clusters are split at each step. Various bisection strategies have been proposed in the literature, with some of the most common ones being:
-
K-means or K-medoids based
The cluster is split into two subclusters using the K-means or K-medoids algorithm, with K set to 2. -
Spectral clustering based
The cluster is divided based on the eigenvectors of the graph Laplacian, which captures the connectivity structure of the data. -
PCA based
The cluster is split along the direction of the first principal component, which captures the largest variance in the data. -
Maximum diameter based
The cluster is divided into two subclusters by finding the pair of data points with the maximum distance and separating the remaining points based on their proximity to these two points.
Implementing Hierarchical Clustering in Python
In this chapter, I will demonstrate how to implement hierarchical clustering in Python. We will use a public dataset, apply various linkage methods, and visualize the results with dendrograms and other plots.
Loading the Dataset and Preprocessing
For this demonstration, we will use the famous Iris dataset. The dataset consists of 150 samples of iris flowers, with four features (sepal length, sepal width, petal length, and petal width) and three species (setosa, versicolor, and virginica).
First, let's load the dataset and preprocess the data:
import numpy as np
import pandas as pd
from sklearn import datasets

# Load the Iris dataset
iris = datasets.load_iris()
X = iris.data
y = iris.target
target_names = iris.target_names

# Create a DataFrame for easier manipulation
df = pd.DataFrame(X, columns=iris.feature_names)
df['species'] = [target_names[i] for i in y]
Performing Hierarchical Clustering
Next, we will perform hierarchical clustering using Scikit-learn's AgglomerativeClustering class and the SciPy library for dendrogram visualization:
from sklearn.cluster import AgglomerativeClustering
from scipy.cluster.hierarchy import dendrogram, linkage

# Define the linkage methods to compare
linkage_methods = ['single', 'complete', 'average', 'ward']

# Perform hierarchical clustering with each linkage method
clustering_results = {}
for method in linkage_methods:
    clustering = AgglomerativeClustering(n_clusters=None, distance_threshold=0, linkage=method)
    clustering.fit(X)
    Z = linkage(X, method)
    clustering_results[method] = Z
Visualizing Dendrograms with Different Linkage Methods
We will now visualize the dendrograms:
import matplotlib.pyplot as plt
import seaborn as sns

sns.set(style='white', rc={'figure.figsize': (8, 5)})

# Plot dendrograms for each linkage method
for method, Z in clustering_results.items():
    plt.figure()
    plt.title(f'Dendrogram for {method.capitalize()} Linkage', fontsize=12)
    dendrogram(Z, truncate_mode='level', p=5, color_threshold=None, above_threshold_color='k', no_labels=True)
    plt.xlabel('Sample Index', fontsize=14)
    plt.ylabel(f'{method.capitalize()} Distance', fontsize=14)
    plt.grid(False)
    sns.despine()
    plt.show()
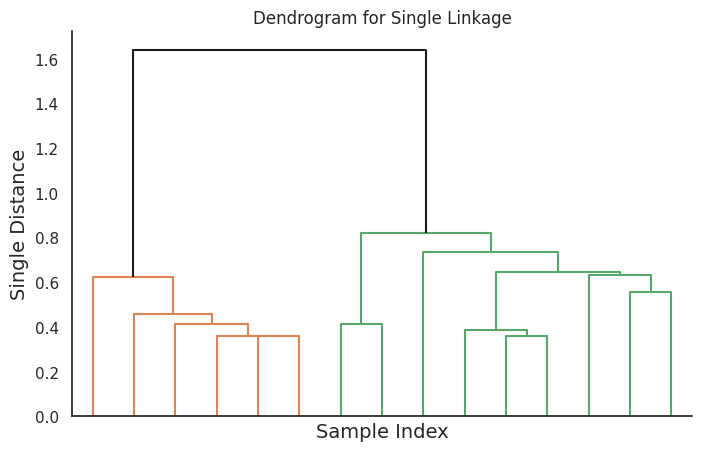
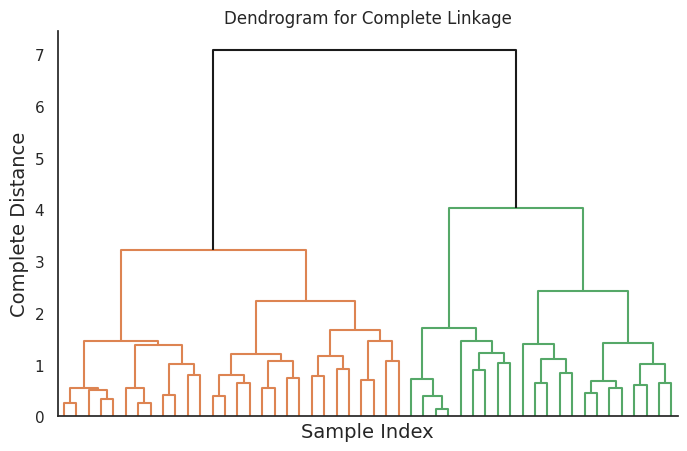
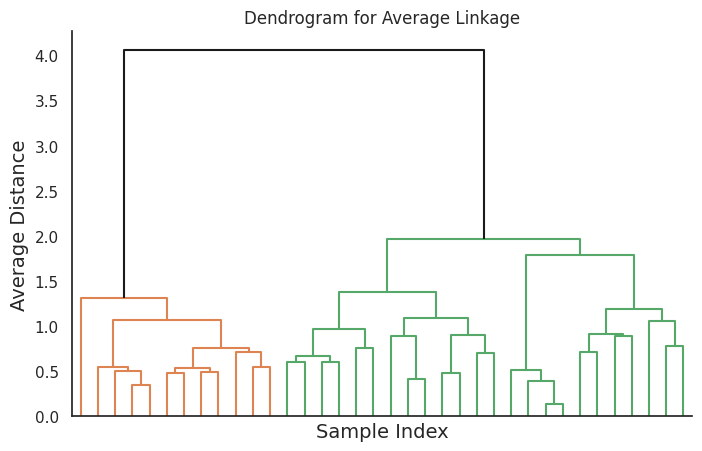
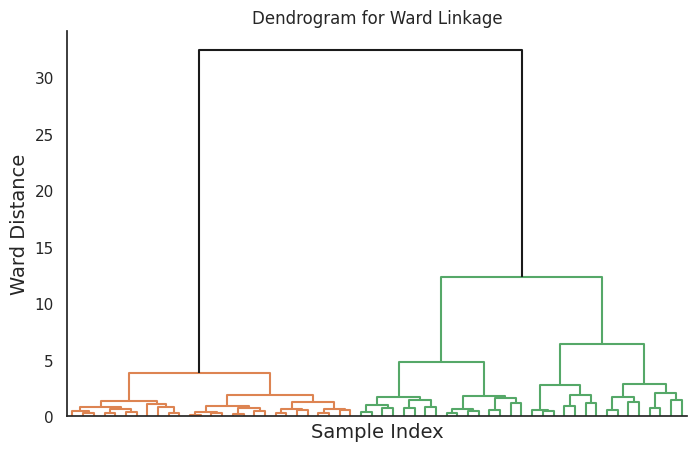
This code will generate four dendrograms, each corresponding to a different linkage method.
References


Ryusei Kakujo


Weave the future of cities through data
Transportation modeling/ Urban planning/ Machine learning/ Computer science/ GIS