

What is Inferential Statistics
Inferential statistics is a branch of statistics that allows researchers to draw conclusions about a population based on information gathered from a sample. It involves making generalizations, predictions, and estimations about a population by analyzing the characteristics and patterns observed in the sample. Inferential statistics plays a crucial role in various fields, including social sciences, natural sciences, economics, and medicine.
Populations and Samples
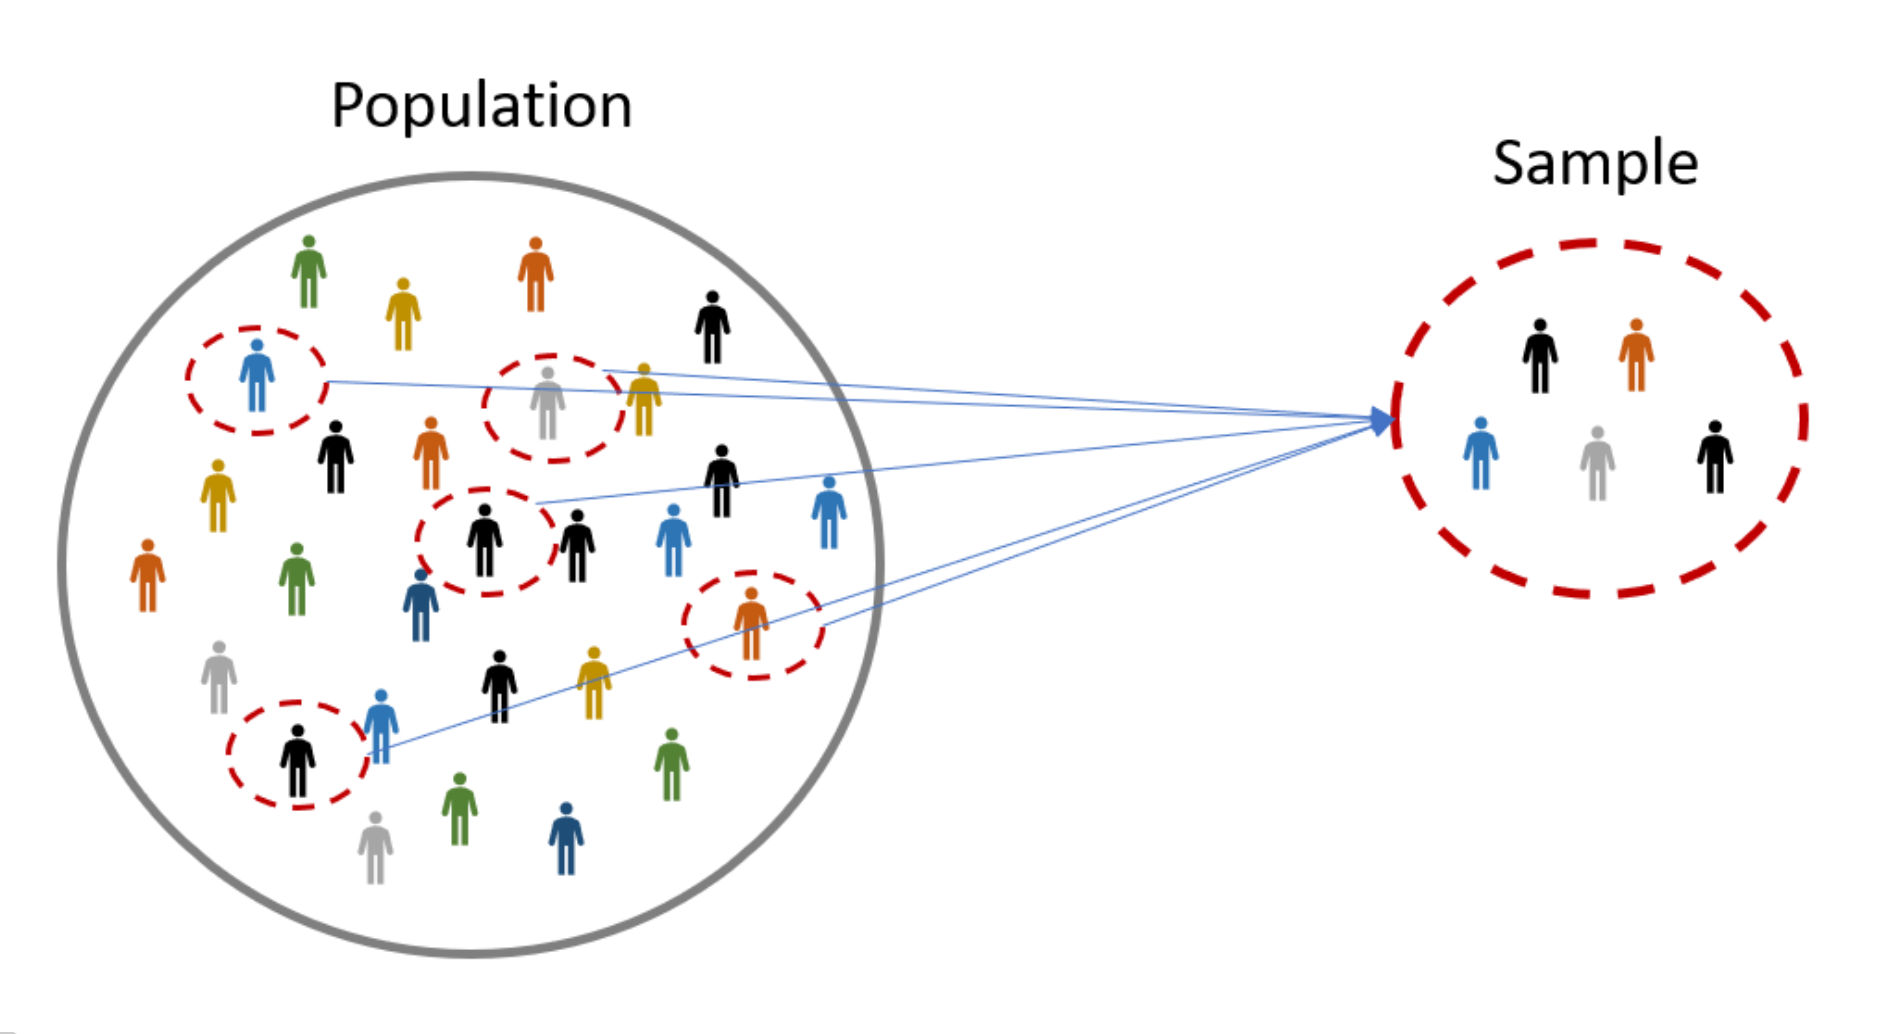
A population refers to the complete set of individuals, objects, or observations that are of interest to researchers. In most cases, studying the entire population is infeasible due to time, cost, and logistical constraints. Therefore, researchers rely on samples, which are subsets of the population, to gather information and make inferences about the population.
Estimation and Statistical Tests
Inferential statistics has two main types: estimation and hypothesis testing.
Estimation
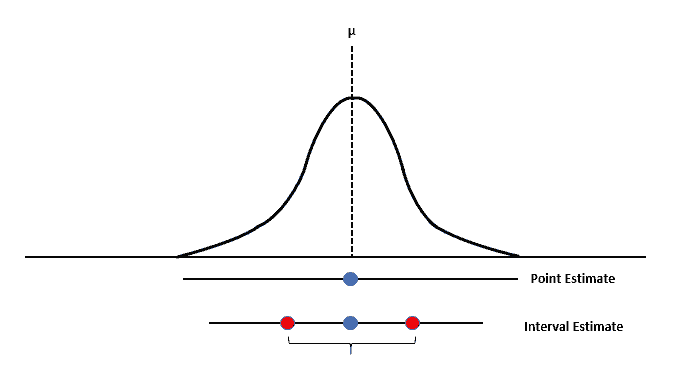
Estimation is a fundamental concept in inferential statistics that involves using sample data to estimate population parameters. There are two primary types of estimation techniques: point estimation and interval estimation. In general, estimation techniques aim to provide accurate and precise estimates of population parameters, while accounting for the uncertainty and variability associated with the sampling process.
Hypothesis Testing
Hypothesis testing is a widely used inferential technique that allows researchers to evaluate the evidence for or against a specific claim or assumption about a population parameter. The process of hypothesis testing involves the following steps:
-
Formulate the null hypothesis (H0) and the alternative hypothesis (H1)
The null hypothesis is a statement that there is no effect or relationship between the variables of interest, while the alternative hypothesis suggests the presence of an effect or relationship. -
Choose an appropriate test statistic
The test statistic is a numerical value calculated from the sample data and used to evaluate the evidence against the null hypothesis. Different statistical tests have different test statistics, depending on the type of data and assumptions made about the population. -
Determine the sampling distribution of the test statistic under the null hypothesis
This step involves identifying the distribution of the test statistic if the null hypothesis were true. The sampling distribution allows researchers to calculate the probability of observing the test statistic or a more extreme value, given the null hypothesis is true. -
Compute the p-value
The p-value is the probability of observing a test statistic as extreme as or more extreme than the one calculated from the sample data, assuming the null hypothesis is true. A small p-value (typically less than 0.05) indicates strong evidence against the null hypothesis, and researchers may reject the null hypothesis in favor of the alternative hypothesis. -
Make a decision
Based on the p-value and a pre-specified significance level (usually 0.05), researchers decide whether to reject or fail to reject the null hypothesis. If the p-value is less than the significance level, the result is considered statistically significant, and the null hypothesis is rejected.
Point Estimation and Interval Estimation
Point Estimators
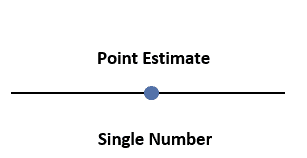
Point estimation involves using sample data to calculate a single value that serves as the best estimate of a population parameter. Point estimators are statistics that provide such estimates, and some common point estimators include the sample mean (for estimating the population mean) and the sample proportion (for estimating the population proportion).
Interval Estimators: Confidence Intervals
While point estimators provide a single value as the best estimate of a population parameter, they do not convey the uncertainty associated with the estimation process. Interval estimation addresses this issue by providing a range of values within which the population parameter is likely to lie, along with a specified level of confidence.
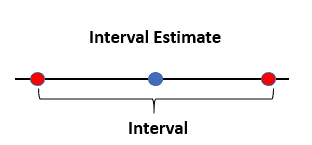
Confidence intervals are a common type of interval estimator, and they are constructed using the point estimate, the standard error of the estimate, and a critical value from an appropriate probability distribution (such as the t-distribution or the normal distribution). A confidence interval is typically expressed in the form:
Point estimate ± (Critical value × Standard error)
The level of confidence (usually 95%) represents the probability that the confidence interval contains the true population parameter in repeated sampling.


Ryusei Kakujo


Weave the future of cities through data
Transportation modeling/ Urban planning/ Machine learning/ Computer science/ GIS