


What is Hypothesis Testing
Hypothesis Testing is a method of statistical estimation in which a hypothesis is formulated for a population and a sample is used to statistically test the truth or falsity of the hypothesis. In hypothesis testing, the Alternative hypothesis is assumed and the Null hypothesis is assumed as the hypothesis that is incompatible with that claim, and when the null hypothesis is rejected, or in other words, negated, the alternative hypothesis is considered to be true in a back-rational way.
Hypothesis Testing Procedure
Hypothesis testing is performed according to the following procedure:
- Formulate the null and alternative hypothesis
- Calculate the test statistic (selection of the test)
- Set the significance level α (setting the rejection region)
- Reject or accept the null hypothesis
Formulate Null and Alternative Hypothesis
Express the hypothesis statistically so that the probability that the sample will be observed assuming the hypothesis is true can be calculated. The test is a choice between the following two options, and the objective is to test whether the null hypothesis can be rejected.
- Null hypothesis
The null hypothesis is a hypothesis that can be formulated to determine whether it is correct or not. The null hypothesis is then tested and a conclusion is drawn. The null hypothesis is written asH_0 - Alternative hypothesis
The alternative hypothesis is the hypothesis that opposes the null hypothesis and is adopted when the null hypothesis is rejected. The alternative hypothesis is the hypothesis that we originally want to prove. The alternative hypothesis is written asH_1
For example, if we want to test whether the effect of a drug can be claimed significantly, the null and alternative hypotheses are set as follows, respectively.
- Null hypothesis (
H_0 - Alternative hypothesis (
H_1
Here, since hypothesis testing is a test that rejects the null hypothesis and aims to prove the correctness of what you want to claim, you must always set the hypothesis you want to claim as the alternative hypothesis and the hypothesis you do not want to claim as the null hypothesis.
There are two reasons why hypothesis tests take the approach of explaining the correctness of the hypothesis (alternative hypothesis) by rejecting the null hypothesis.
- It is sometimes difficult to directly prove the alternative hypothesis.
- To avoid careless selection of the alternative hypothesis.
For the first reason, the alternative hypothesis may not be possible to calculate probabilities. For example, if we suspect that the probability of two sides of a coin is not 1/2, the null hypothesis and the alternative hypothesis are as follows
- Null hypothesis (
H_0 - Alternative hypothesis (
H_1
Here, in order to calculate the probability of two sides of a coin, once the probability is set to 1/2, i.e., the null hypothesis must be assumed to be correct, otherwise the probability cannot be calculated. So, the process is to assume that the null hypothesis is correct, which allows us to calculate the probability, and then statistically reject the null hypothesis to prove the alternative hypothesis.
For the second reason, the test has two errors α error and β error.
| The alternative hypothesis is correct | The null hypothesis is correct | |
|---|---|---|
| Reject the null hypothesis | α error | OK |
| Accept the null hypothesis | OK | β error |
Whether alpha or beta error is the more important error depends on the case. In the case of a beta error, at least the conclusion is maintained. The idea of hypothesis testing is to avoid easily adopting an alternative hypothesis by setting a strict significance level to make α errors less likely to occur.
Calculate Test Statistic (Selection of Test)
A test statistic is a statistic calculated from a sample according to certain rules for hypothesis testing. The method of calculating the test statistic depends on the distribution of the population and other factors.
Typical test statistics include the T-test, F-test, Z-test, and Chi-square test.
| Test Name | Test Statistic | Objective |
|---|---|---|
| T test | t-value | Whether the means of two populations are significantly different or not |
| F test | f value | Whether the standard deviations of the two populations are significantly different or not |
| Z test | z value | Whether the sample mean and the population mean are statistically significantly different or not |
| Chi-square test | Chi-square value | Whether the two observations for the two variables are independent of each other (independence) and whether the observed frequency distribution is the same as the theoretical distribution (goodness of fit) |
Set Significance Level α (Setting Rejection Region)
Assuming that the null hypothesis is true, the entire distribution of the test statistic is divided into a Rejection Region and an Acceptance Region, and the probability that the null hypothesis falls within the Rejection Region is the significance level of the test. In other words, the significance level is the standard probability for determining that the null hypothesis is false. The significance level is usually set at a small value such as 1% or 5%.
When testing, the conclusion is to reject the null hypothesis because the test statistic falls within the rejection region, i.e., the event occurred in a way that is rare for the distribution being tested. When the test statistic falls within the rejection region and the null hypothesis is rejected, the expression "statistically significant" is used.
There are two-tailed test and one-tailed test as below.
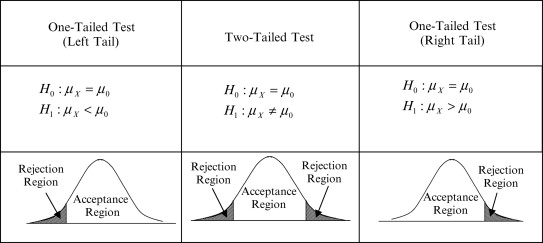
The one-tailed test is a method of testing where only the left or right side probability is taken as the significance level α. Since only one side is taken as the significance level α, the rejection range is wider than that of a two-tailed test at the same significance level. In other words, one-tailed tests are more likely to reject the null hypothesis than two-tailed tests. For example, at the significance level α=0.05, the two-tailed test has a rejection range of 2.5% on each side, while the one-sided test has a rejection range of 5% on either side.
The one-tailed test is performed in the following cases:
- When the sample mean is clearly known to be larger (smaller) than a specific value.
- When you want to examine only that the sample mean is larger (smaller) than a specific value.
Reject or Accept Null Hypothesis
Determines whether the calculated test statistic is within rejection region. Usually, the probability
On the other hand, if the test statistic is outside the rejection region, there is insufficient evidence to reject the null hypothesis, and the null hypothesis cannot be rejected and the test fails. In other words, in this case, we are left not knowing whether the null or the alternative hypothesis is true. Since the hypothesis test is a method of rejecting the opposing null hypothesis in order to statistically clarify the claim that the alternative hypothesis is true, it is not a test to prove that the null hypothesis is true, and thus ends up in this way.
Hypothesis Testing Example
In this case, we will conduct a hypothesis test to verify whether the weight of the French fries at the hamburger store in front of the station is as the published value of 135g.
First, we consider the hypothesis. Assuming that we suspect that the weight of the fries is not as published, the null and alternative hypotheses are as follows
- Null hypothesis (
H_0 - Alternative hypothesis (
H_1
Suppose that 10 French fries are purchased at the hamburger store in front of the station and the weight of each French fry is measured as follows:
- 130g
- 140g
- 124g
- 120g
- 133g
- 126g
- 131g
- 132g
- 130g
- 134g
The sample mean
Next, we calculate the test statistic. This time, we assume that the population variance is known and
- The population variance is unknown
- Sample size is less than 30
Assuming that the weight of French fries at the hamburger store in front of the station follows a normal distribution, the sample mean of the 10 purchased fries (n=10) follows
Next, set the significance level. In this case, the significance level is set to α=0.05, which is the most common value. Since we are testing whether the weight of the French fries is 135g, which is the published value, we adopt a two-tailed test.
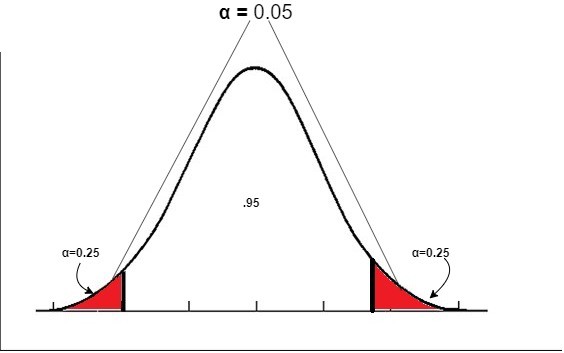
Hypothesis Testing — 2-tailed test
The red area in the above figure is the rejection region. The rejection region accounts for 5% of the total, and the rejection regions at both ends each account for 2.5% of the total.
Finally, the p-value is obtained. Since the test statistic Z follows a standard normal distribution, we check the value corresponding to the test statistic z = -2.64 from the standard normal distribution table below.
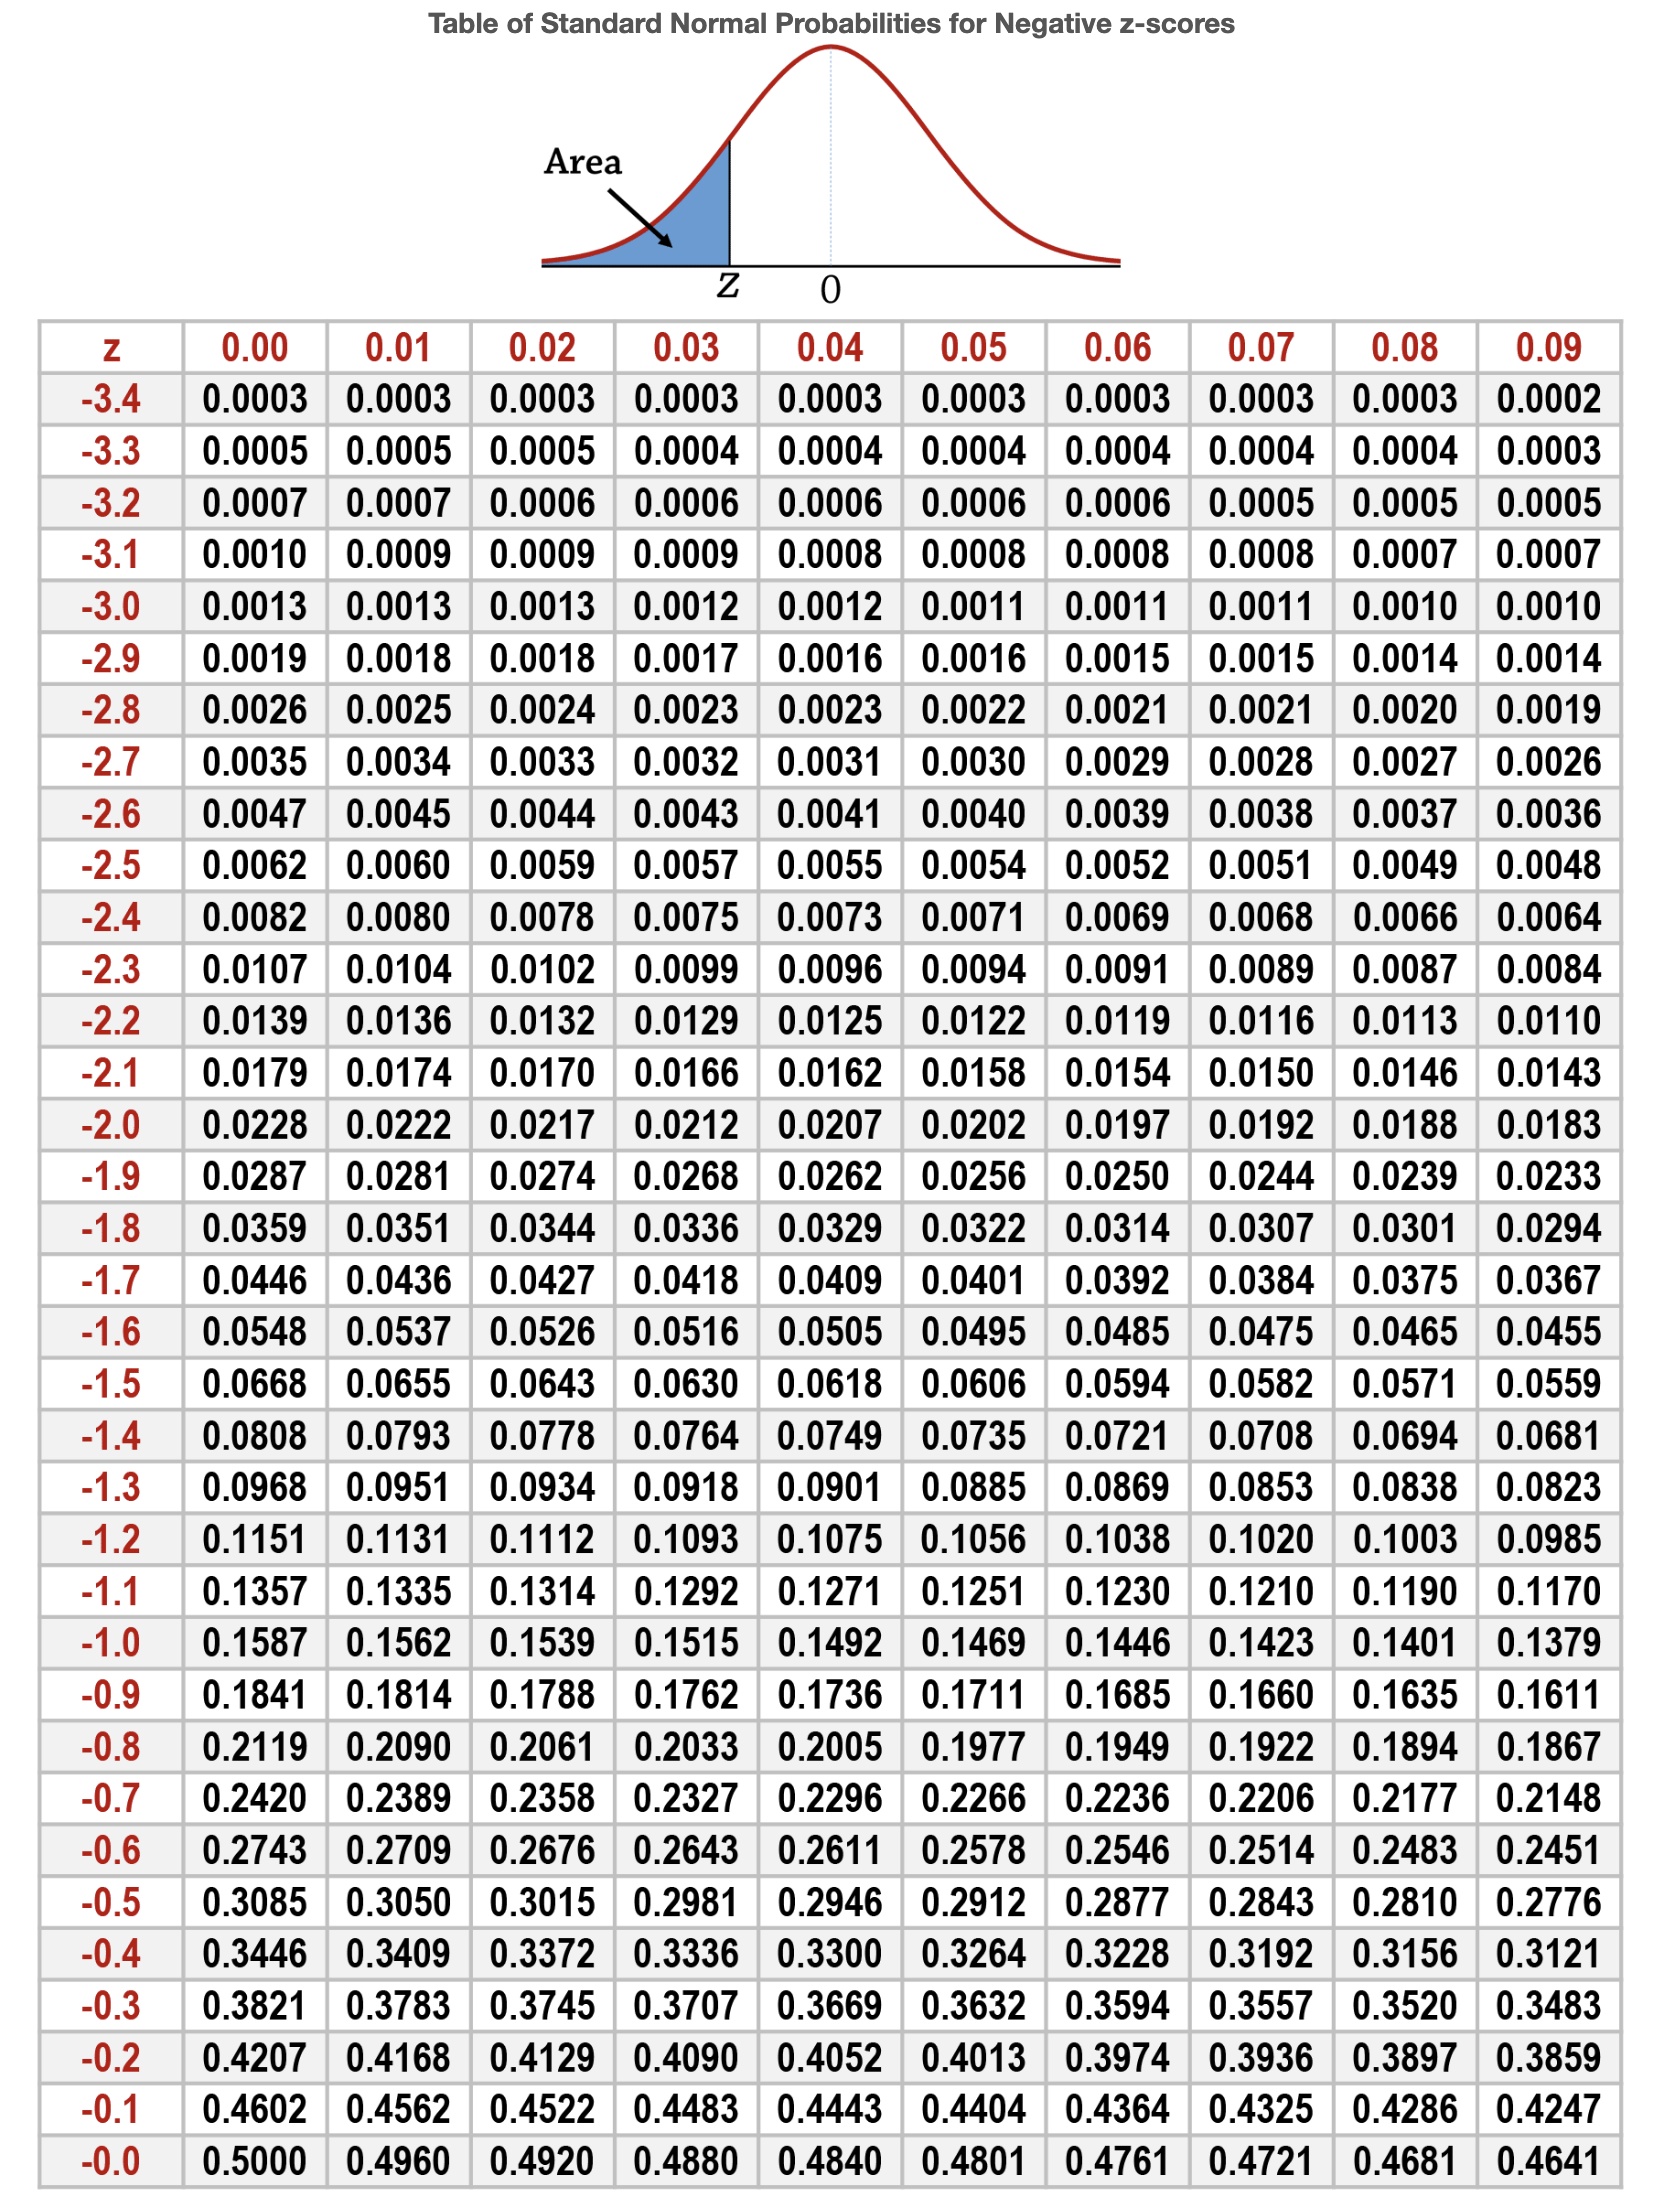
The test statistic z = -2.64 has a value of 0.0041. Since this is a two-tailed test, p = 0.0082, and p < α, we can conclude that it is very rare for the observed event to occur under the hypothesis we set.
Therefore, the conclusion of the test is that the null hypothesis is rejected and the alternative hypothesis is adopted. This means that the weight of the French fries at the hamburger store in front of the station is not the published value of 135g.
References


Ryusei Kakujo


Weave the future of cities through data
Transportation modeling/ Urban planning/ Machine learning/ Computer science/ GIS