


What is F-distribution
F-distribution is a probability distribution that the following random variable
The F distribution is sometimes denoted
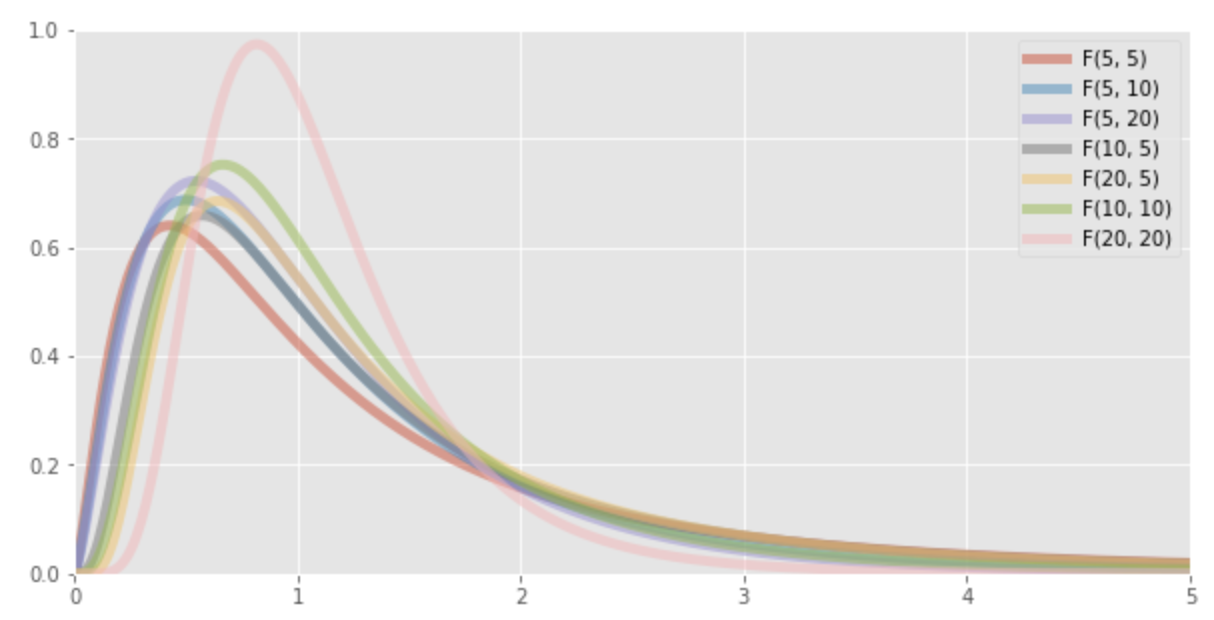
The graph of the F-distribution depends on the degrees of freedom
Expected value and variance of the F-distribution
The expected value and variance of the random variable
F-distribution table (upper side)
Since the F-distribution has only
| 1 | 2 | 3 | 4 | 5 | 6 | 7 | |
|---|---|---|---|---|---|---|---|
| 1 | 161.448 | 199.500 | 215.707 | 224.583 | 230.162 | 233.986 | 236.768 |
| 2 | 18.513 | 19.000 | 19.164 | 19.247 | 19.296 | 19.330 | 19.353 |
| 3 | 10.128 | 9.552 | 9.277 | 9.117 | 9.013 | 8.941 | 8.887 |
| 4 | 7.709 | 6.944 | 6.591 | 6.388 | 6.256 | 6.163 | 6.094 |
| 5 | 6.608 | 5.786 | 5.409 | 5.192 | 5.050 | 4.950 | 4.876 |
| 10 | 4.965 | 4.103 | 3.708 | 3.478 | 3.326 | 3.217 | 3.135 |
| 15 | 4.543 | 3.682 | 3.287 | 3.056 | 2.901 | 2.790 | 2.707 |
| 20 | 4.351 | 3.493 | 3.098 | 2.866 | 2.711 | 2.599 | 2.514 |
For example, the F value with
Python Code
The following is the Python code used to draw the F-distribution.
from scipy import stats
import matplotlib.pyplot as plt
import numpy as np

plt.style.use('ggplot')
fig, ax = plt.subplots(facecolor="w", figsize=(10, 5))

x = np.linspace(0.000001, 10, 1000) # X axis
f_df = [(5,5), (5,10), (5,20), (10,5), (20,5), (10,10), (20,20)] # degree of freedom of F(m,n)

for i in range(len(f_df)):
    y = stats.f.pdf(x, f_df[i][0], f_df[i][1])
    ax.plot(x, y, linestyle='-', label=f'F({f_df[i][0]}, {f_df[i][1]})', lw=5, alpha=0.5)

plt.xlim(0, 5)
plt.ylim(0, 1.0)
plt.legend()
plt.show()


Ryusei Kakujo


Weave the future of cities through data
Transportation modeling/ Urban planning/ Machine learning/ Computer science/ GIS