


What is the Chi-square distribution
The chi-square distribution is the probability distribution that the random variables
The probability density function of the chi-square distribution is expressed by the following equation:
The probability density function of the chi-square distribution, like the probability density function of the t-distribution, has only
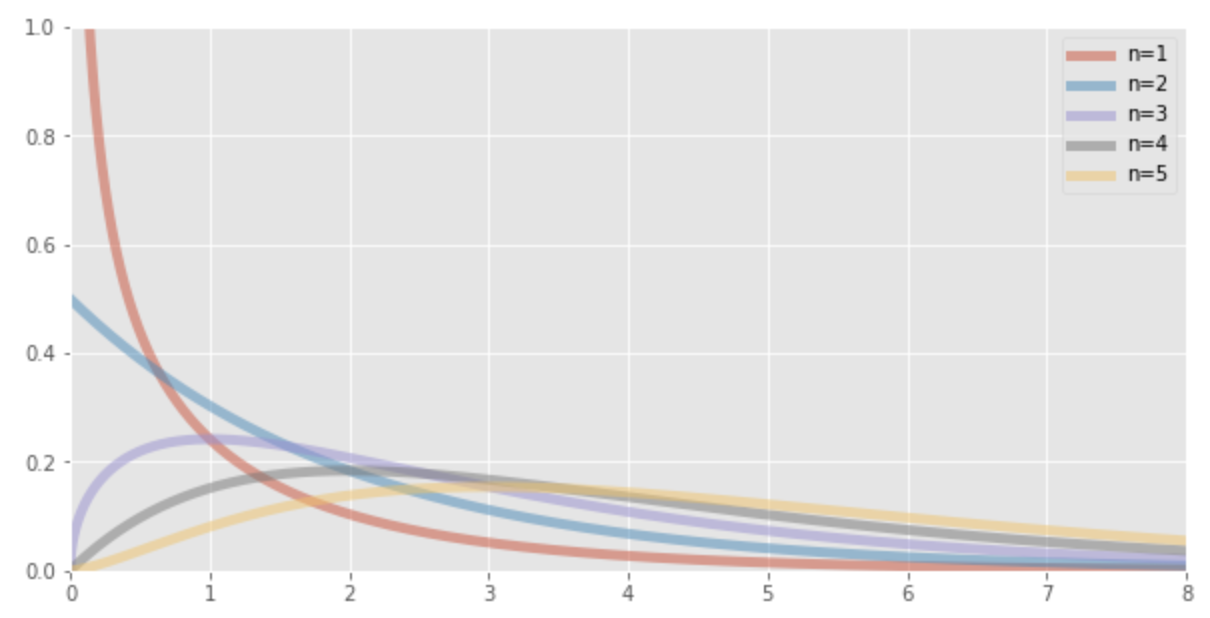
The graph of the chi-square distribution depends on the
Relationship to the standard normal distribution
The chi-square distribution with 1 degree of freedom is equal to the squared random variable
Expected value and variance of the chi-square distribution
The expected value and variance of the random variable
Chi-Square distribution table (upper side)
Since the chi-square distribution has only
| Freedom of degree |
||||
|---|---|---|---|---|
| 1 | 2.71 | 3.84 | 5.02 | 6.64 |
| 2 | 4.61 | 5.99 | 7.38 | 9.21 |
| 3 | 6.25 | 7.82 | 9.35 | 11.35 |
| 4 | 7.78 | 9.49 | 11.14 | 13.28 |
| 5 | 9.24 | 11.07 | 12.83 | 15.09 |
| 6 | 10.65 | 12.59 | 14.45 | 16.81 |
| 7 | 12.02 | 14.07 | 16.01 | 18.48 |
| 8 | 13.36 | 15.51 | 17.54 | 20.09 |
| 9 | 14.68 | 16.92 | 19.02 | 21.67 |
| 10 | 15.99 | 18.31 | 20.48 | 23.21 |
For example, if you want to find the upper 5% point of the chi-square distribution with 5 degrees of freedom, look for the value at the intersection of
Reproductive property of chi-Square distribution
Suppose that the random variables
In this case,
This property is called the reproductive property.
Random sample from a population following a normal distribution and chi-square distribution
In a randomly selected samples
Also, as the unbiased variance is
Python Code
The following is the Python code used to draw the chi-square distribution.
from scipy.stats import chi2
import numpy as np
import matplotlib.pyplot as plt

plt.style.use('ggplot')
fig, ax = plt.subplots(facecolor="w", figsize=(10, 5))

x = np.linspace(0, 8, 10000)

k_deg = [1, 2, 3, 4, 5] # degree of freedom

for i in k_deg:
    plt.plot(x, chi2.pdf(x, i), linestyle='-', label='n={}'.format(i), lw=5, alpha=0.5)

plt.xlim(0, 8)
plt.ylim(0, 1)
plt.legend()
plt.show()


Ryusei Kakujo


Weave the future of cities through data
Transportation modeling/ Urban planning/ Machine learning/ Computer science/ GIS