


What is Gumbel Distribution
The Gumbel distribution is a type of extreme value distribution that models the behavior of the maximum (or minimum) of a set of independent and identically distributed random variables. It is particularly useful for analyzing extreme events, such as natural disasters, financial crises, or engineering failures. The distribution is characterized by two parameters: the location parameter (
Gumbel Distribution: Mathematical Foundations
Probability Density Function (PDF)
value for a continuous random variable. For the Gumbel distribution, the PDF is given by:
where
Cumulative Distribution Function (CDF)
The cumulative distribution function (CDF) represents the probability that a random variable takes on a value less than or equal to a given value. For the Gumbel distribution, the CDF is given by:
The CDF provides insights into the distribution's tail behavior and can be used to compute percentiles and other summary statistics.
Moments and Characteristic Functions
Moments provide essential information about the shape and central tendency of a distribution. The
where
The characteristic function is another way to describe the distribution and is defined as the Fourier transform of the PDF. The Gumbel distribution's characteristic function is given by:
where
Parameter Estimation: Location and Scale
Estimating the location (
-
Maximum Likelihood Estimation (MLE)
This method maximizes the likelihood function of the observed data, given the distribution's parameters. It provides asymptotically unbiased and efficient estimates for the location and scale parameters. -
Method of Moments
This approach matches the sample moments (mean and variance) to the theoretical moments of the Gumbel distribution. It provides consistent, albeit less efficient, estimates compared to MLE.
Applications of Gumbel Distribution
This article explores some of the key applications of the Gumbel Distribution, including hydrology, engineering, finance, and machine learning.
Extreme Value Analysis in Hydrology
Hydrologists often rely on the Gumbel Distribution to analyze extreme events like floods and droughts. It helps them estimate the probability of occurrence and magnitude of such events, providing valuable insights for designing infrastructure like dams, bridges, and levees. By understanding the distribution of extreme rainfall or river discharge levels, hydrologists can make informed decisions to improve water resource management and enhance flood mitigation strategies.
Risk Assessment in Engineering
In the field of engineering, the Gumbel Distribution plays a critical role in risk assessment and management. Engineers use this distribution to analyze the probability of failure of structures under extreme loads or extreme environmental conditions. By determining the maximum stress or load a structure can endure, they can design and maintain safer and more reliable infrastructure. This application is particularly relevant in civil, structural, and environmental engineering.
Portfolio Optimization in Finance
The Gumbel Distribution is a valuable tool in finance for optimizing investment portfolios. Portfolio managers often use it to model the extreme returns of financial assets, allowing them to estimate potential losses during extreme market events. By incorporating the Gumbel Distribution in Value-at-Risk (VaR) models and tail risk analysis, investors can make more informed decisions to minimize potential losses and enhance their risk-adjusted returns.
Machine Learning and Neural Networks
In recent years, the Gumbel Distribution has found its way into the domain of machine learning and artificial neural networks. One prominent example is the Gumbel-Softmax technique, which is used for discrete sampling in reinforcement learning and optimization problems. The Gumbel-Softmax technique leverages the Gumbel Distribution to approximate discrete probability distributions, enabling more efficient and stable training processes. Furthermore, researchers are exploring the potential of Gumbel Distribution in deep learning algorithms to model extreme events, such as rare or anomalous data points, which could improve anomaly detection and enhance model robustness.
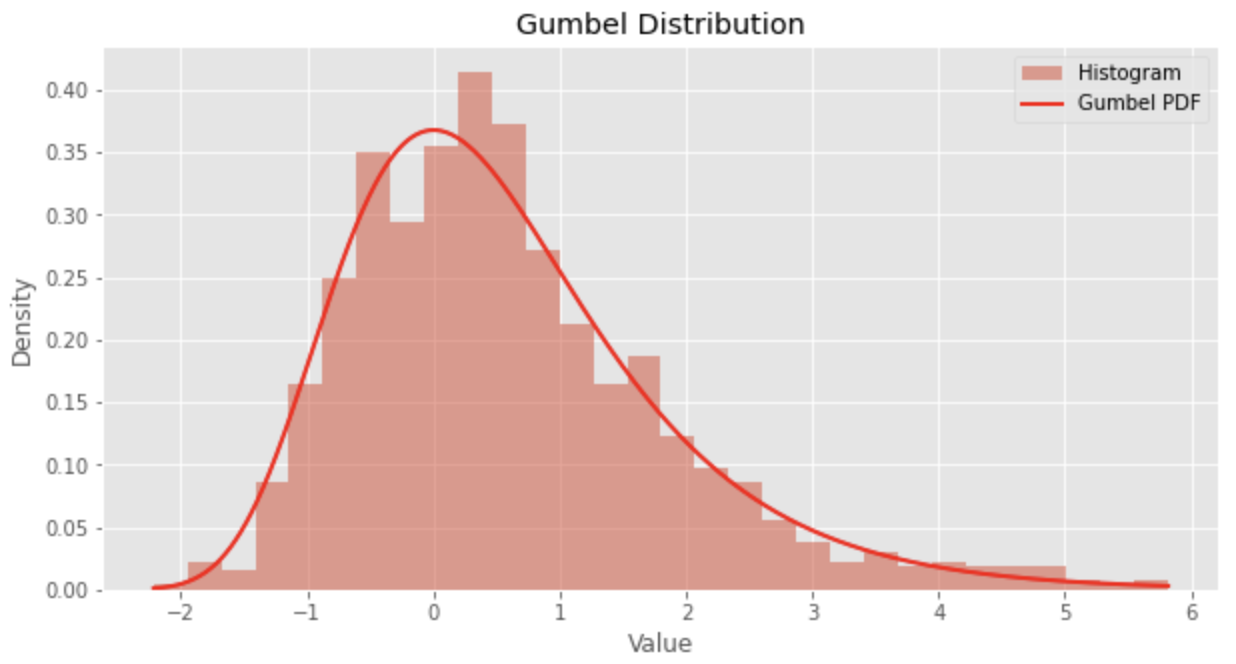
Python Code
Here is a sample code for drawing a Gumbel distribution with Python.
import numpy as np
import matplotlib.pyplot as plt

plt.style.use('ggplot')
fig, ax = plt.subplots(facecolor="w", figsize=(10, 5))

# Gumbel distribution parameters
mu = 0      # Location parameter
sigma = 1    # Scale parameter
size = 1000 # Number of data points

# Generate Gumbel distributed data points
gumbel_data = np.random.gumbel(mu, sigma, size)

# Plot the histogram
plt.hist(gumbel_data, bins=30, density=True, alpha=0.5, label='Histogram')

# Calculate the Gumbel PDF
x = np.linspace(np.min(gumbel_data), np.max(gumbel_data), 1000)
pdf = (1/sigma) * np.exp(-(x-mu)/sigma - np.exp(-(x-mu)/sigma))

# Plot the Gumbel PDF
plt.plot(x, pdf, 'r-', lw=2, label='Gumbel PDF')

# Configure the plot
plt.title('Gumbel Distribution')
plt.xlabel('Value')
plt.ylabel('Density')
plt.legend()

# Show the plot
plt.show()


Ryusei Kakujo


Weave the future of cities through data
Transportation modeling/ Urban planning/ Machine learning/ Computer science/ GIS