

What is Covariance
Covariance is a numerical value that represents the relationship between two variables,
If the covariance is positive, it indicates that both variables tend to increase or decrease together. If the covariance is negative, it means that as one variable increases, the other tends to decrease, and vice versa. A covariance of zero implies that there is no linear relationship between the variables.
The mathematical representation of the covariance between variables
Where:
cov(X,Y) X Y X_i Y_i X Y \overline{X} \overline{Y} X Y n
Covariance vs. Correlation
While covariance measures the direction of the relationship between two variables, correlation quantifies the strength and direction of that relationship. Correlation is a standardized form of covariance, ranging between -1 and 1, whereas covariance can take any value.
The correlation coefficient, denoted by
Where:
r cov(X,Y) X Y \sigma_X \sigma_Y X Y
Calculating Covariance with Python
In this chapter, I will demonstrate how to calculate covariance using Python, including both positive and negative covariance cases. We will also create plots to visualize the relationships between variables.
First, let's import the necessary libraries.
import numpy as np
import pandas as pd
import matplotlib.pyplot as plt
import seaborn as sns
Next, we will create a function to calculate the covariance between two variables.
def covariance(x, y):
    x_mean = np.mean(x)
    y_mean = np.mean(y)
    n = len(x)
    cov = np.sum((x - x_mean) * (y - y_mean)) / (n - 1)
    return cov
Let's create an example with positive covariance.
# Generate sample data with positive covariance
np.random.seed(42)
x_positive = np.random.rand(50)
y_positive = x_positive * 3 + np.random.rand(50)

# Calculate the covariance
positive_cov = covariance(x_positive, y_positive)
print(f"Positive Covariance: {positive_cov}")

# Plot the data
plt.figure(figsize=(10, 6))
sns.set(style="whitegrid")
sns.scatterplot(x=x_positive, y=y_positive, s=100, color="blue", edgecolor="black")
plt.title("Positive Covariance Example", fontsize=20)
plt.xlabel("X", fontsize=16)
plt.ylabel("Y", fontsize=16)
plt.show()
Positive Covariance: 0.25587483932859534
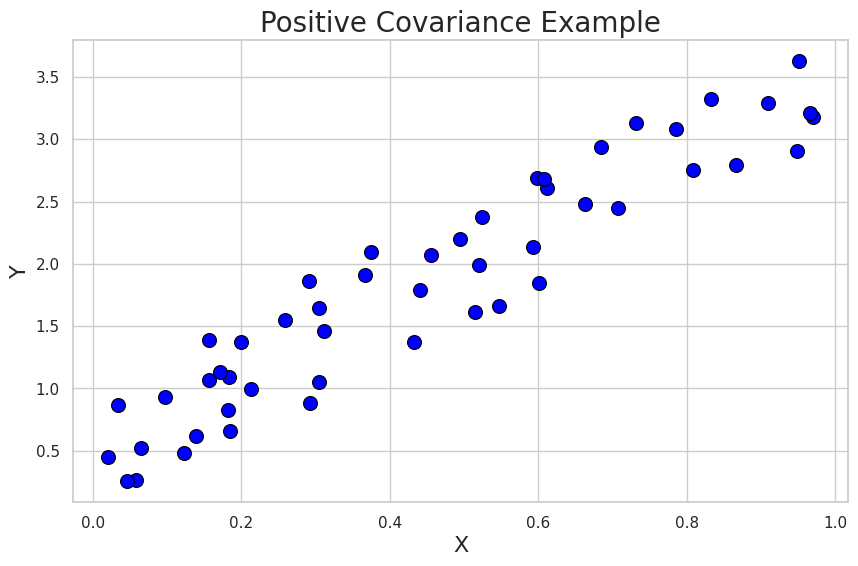
In this example, we can see that as the values of X increase, the values of Y also tend to increase. The plot shows a positive covariance between the variables.
Now, let's create an example with negative covariance.
# Generate sample data with negative covariance
np.random.seed(42)
x_negative = np.random.rand(50)
y_negative = -x_negative * 3 + np.random.rand(50)

# Calculate the covariance
negative_cov = covariance(x_negative, y_negative)
print(f"Negative Covariance: {negative_cov}")

# Plot the data
plt.figure(figsize=(10, 6))
sns.set(style="whitegrid")
sns.scatterplot(x=x_negative, y=y_negative, s=100, color="red", edgecolor="black")
plt.title("Negative Covariance Example", fontsize=20)
plt.xlabel("X", fontsize=16)
plt.ylabel("Y", fontsize=16)
plt.show()
Negative Covariance: -0.2448461835209279
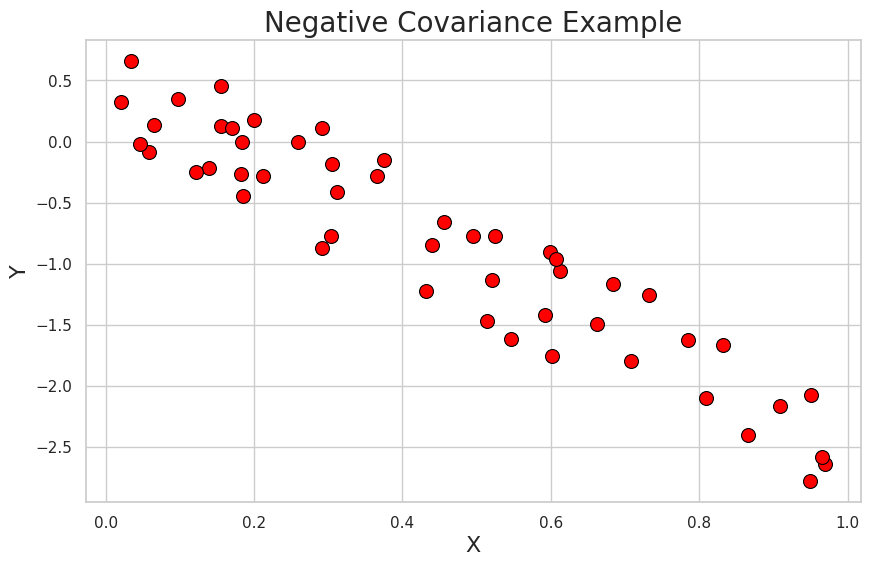
In this example, we can see that as the values of X increase, the values of Y tend to decrease. The plot shows a negative covariance between the variables.


Ryusei Kakujo


Weave the future of cities through data
Transportation modeling/ Urban planning/ Machine learning/ Computer science/ GIS