

What is Streamlit
Streamlit is a Python framework that allows for easy development of data science and machine learning applications without requiring knowledge of HTML, CSS, or other web technologies. It enables data visualization without the need for complex web development.
Installation
You can install Streamlit using the following command:
$ pip install streamlit
Running Streamlit
Create an app.py file with the following content:
import streamlit as st

st.title("hello world")
Then, execute the following command to run the Streamlit app:
$ streamlit run app.py
You can now view your Streamlit app in your browser.

Local URL: http://localhost:8555
You can access your Streamlit application by visiting http://localhost:8555 in your web browser.

Text
With Streamlit, you can display text using Markdown and other text-related functions.
import streamlit as st

st.title("title") # Title
st.header("header") # Header
st.write("write") # Display
st.markdown("# markdown") # markdown
st.text("text") # Text

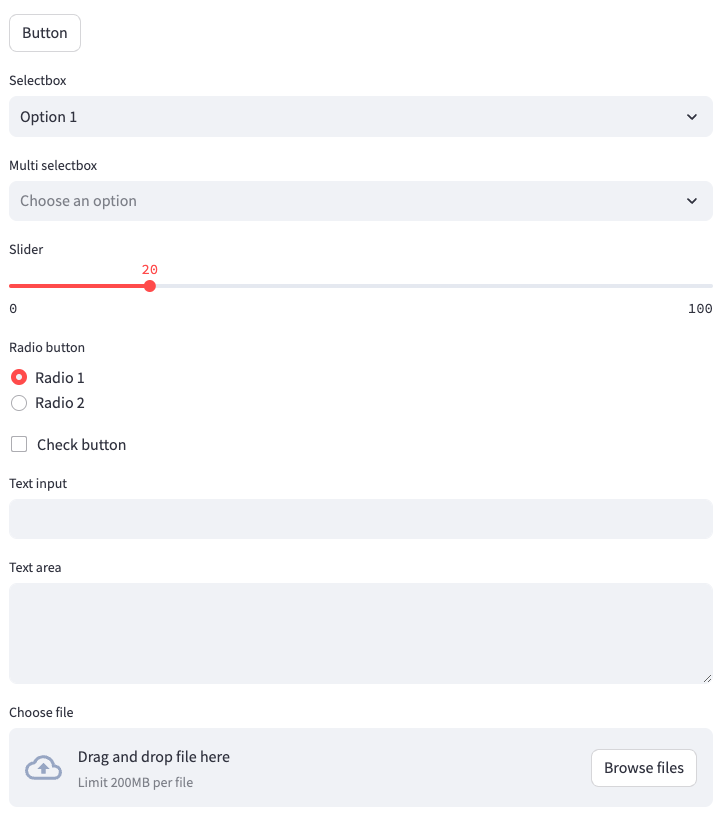
Widgets
Streamlit provides various interactive widgets like sliders, checkboxes, radio buttons, etc.
import streamlit as st

st.button("Button")  # Button
st.selectbox("Selectbox", ("Option 1", "Option 2"))  # Select box
st.multiselect("Multi selectbox", ("Option 1", "Option 2"))  # Multi select box
st.slider("Slider", 0, 100, 20)  # Slider
st.radio("Radio button", ("Radio 1", "Radio 2"))  # Radio button
st.checkbox("Check button")  # Checkbox
st.text_input("Text input")  # Text input (one line)
st.text_area("Text area")  # Text input (multiple line)
st.file_uploader("Choose file")  # File upload
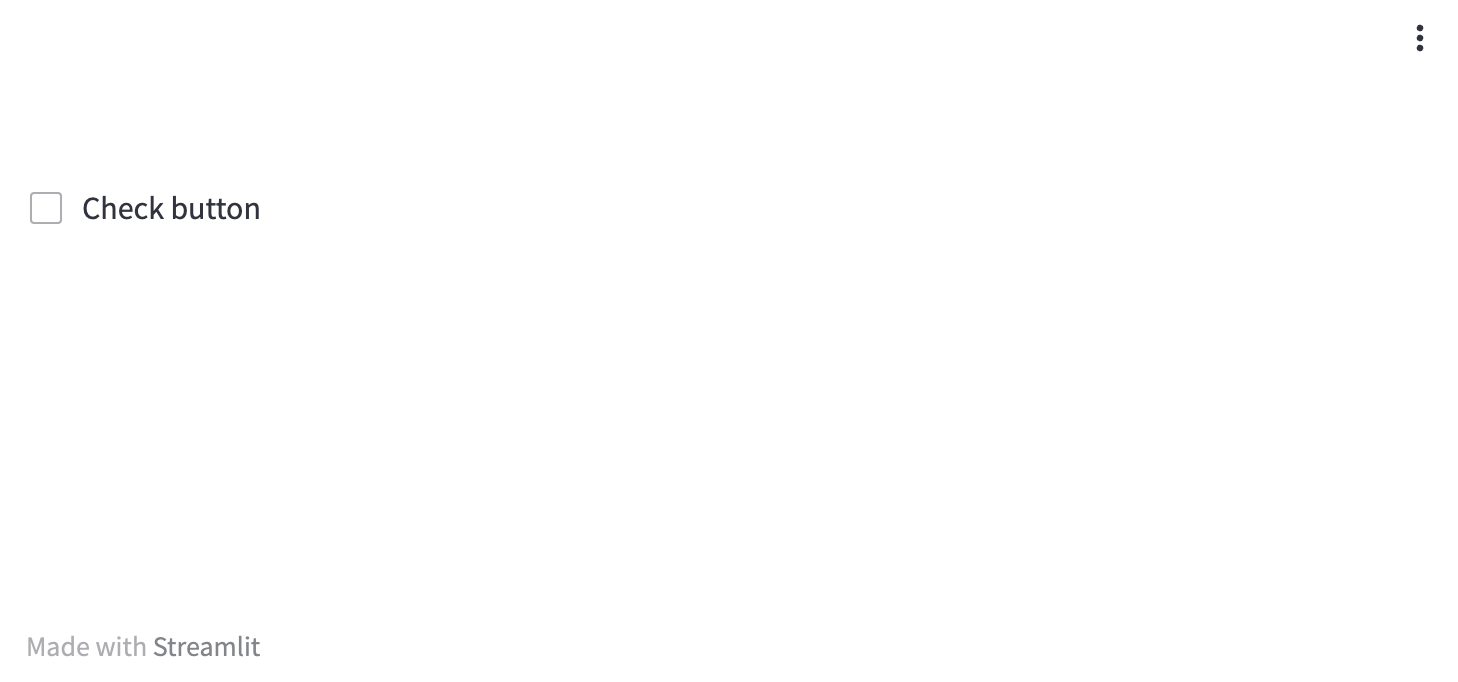
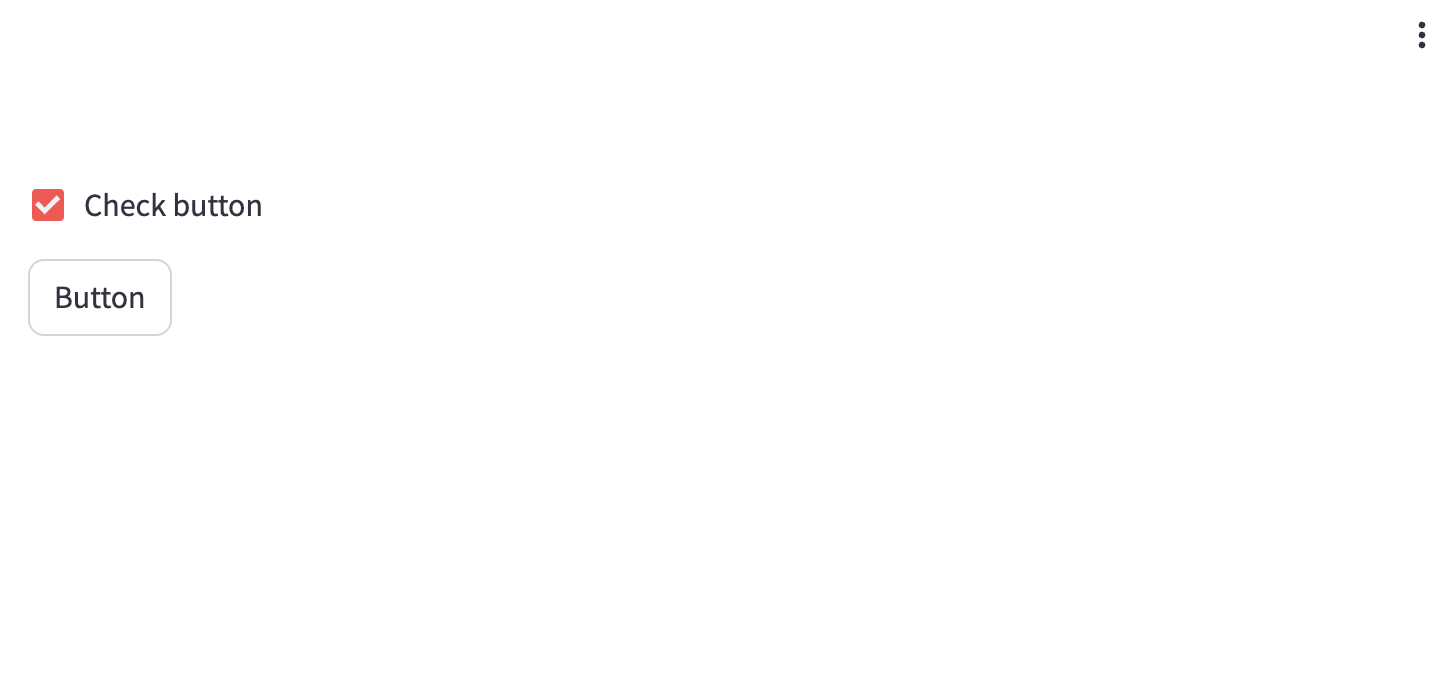
You can control the display of widgets by assigning their return values to variables.
import streamlit as st

checked = st.checkbox("Check button")

if checked:
    st.button("Button")
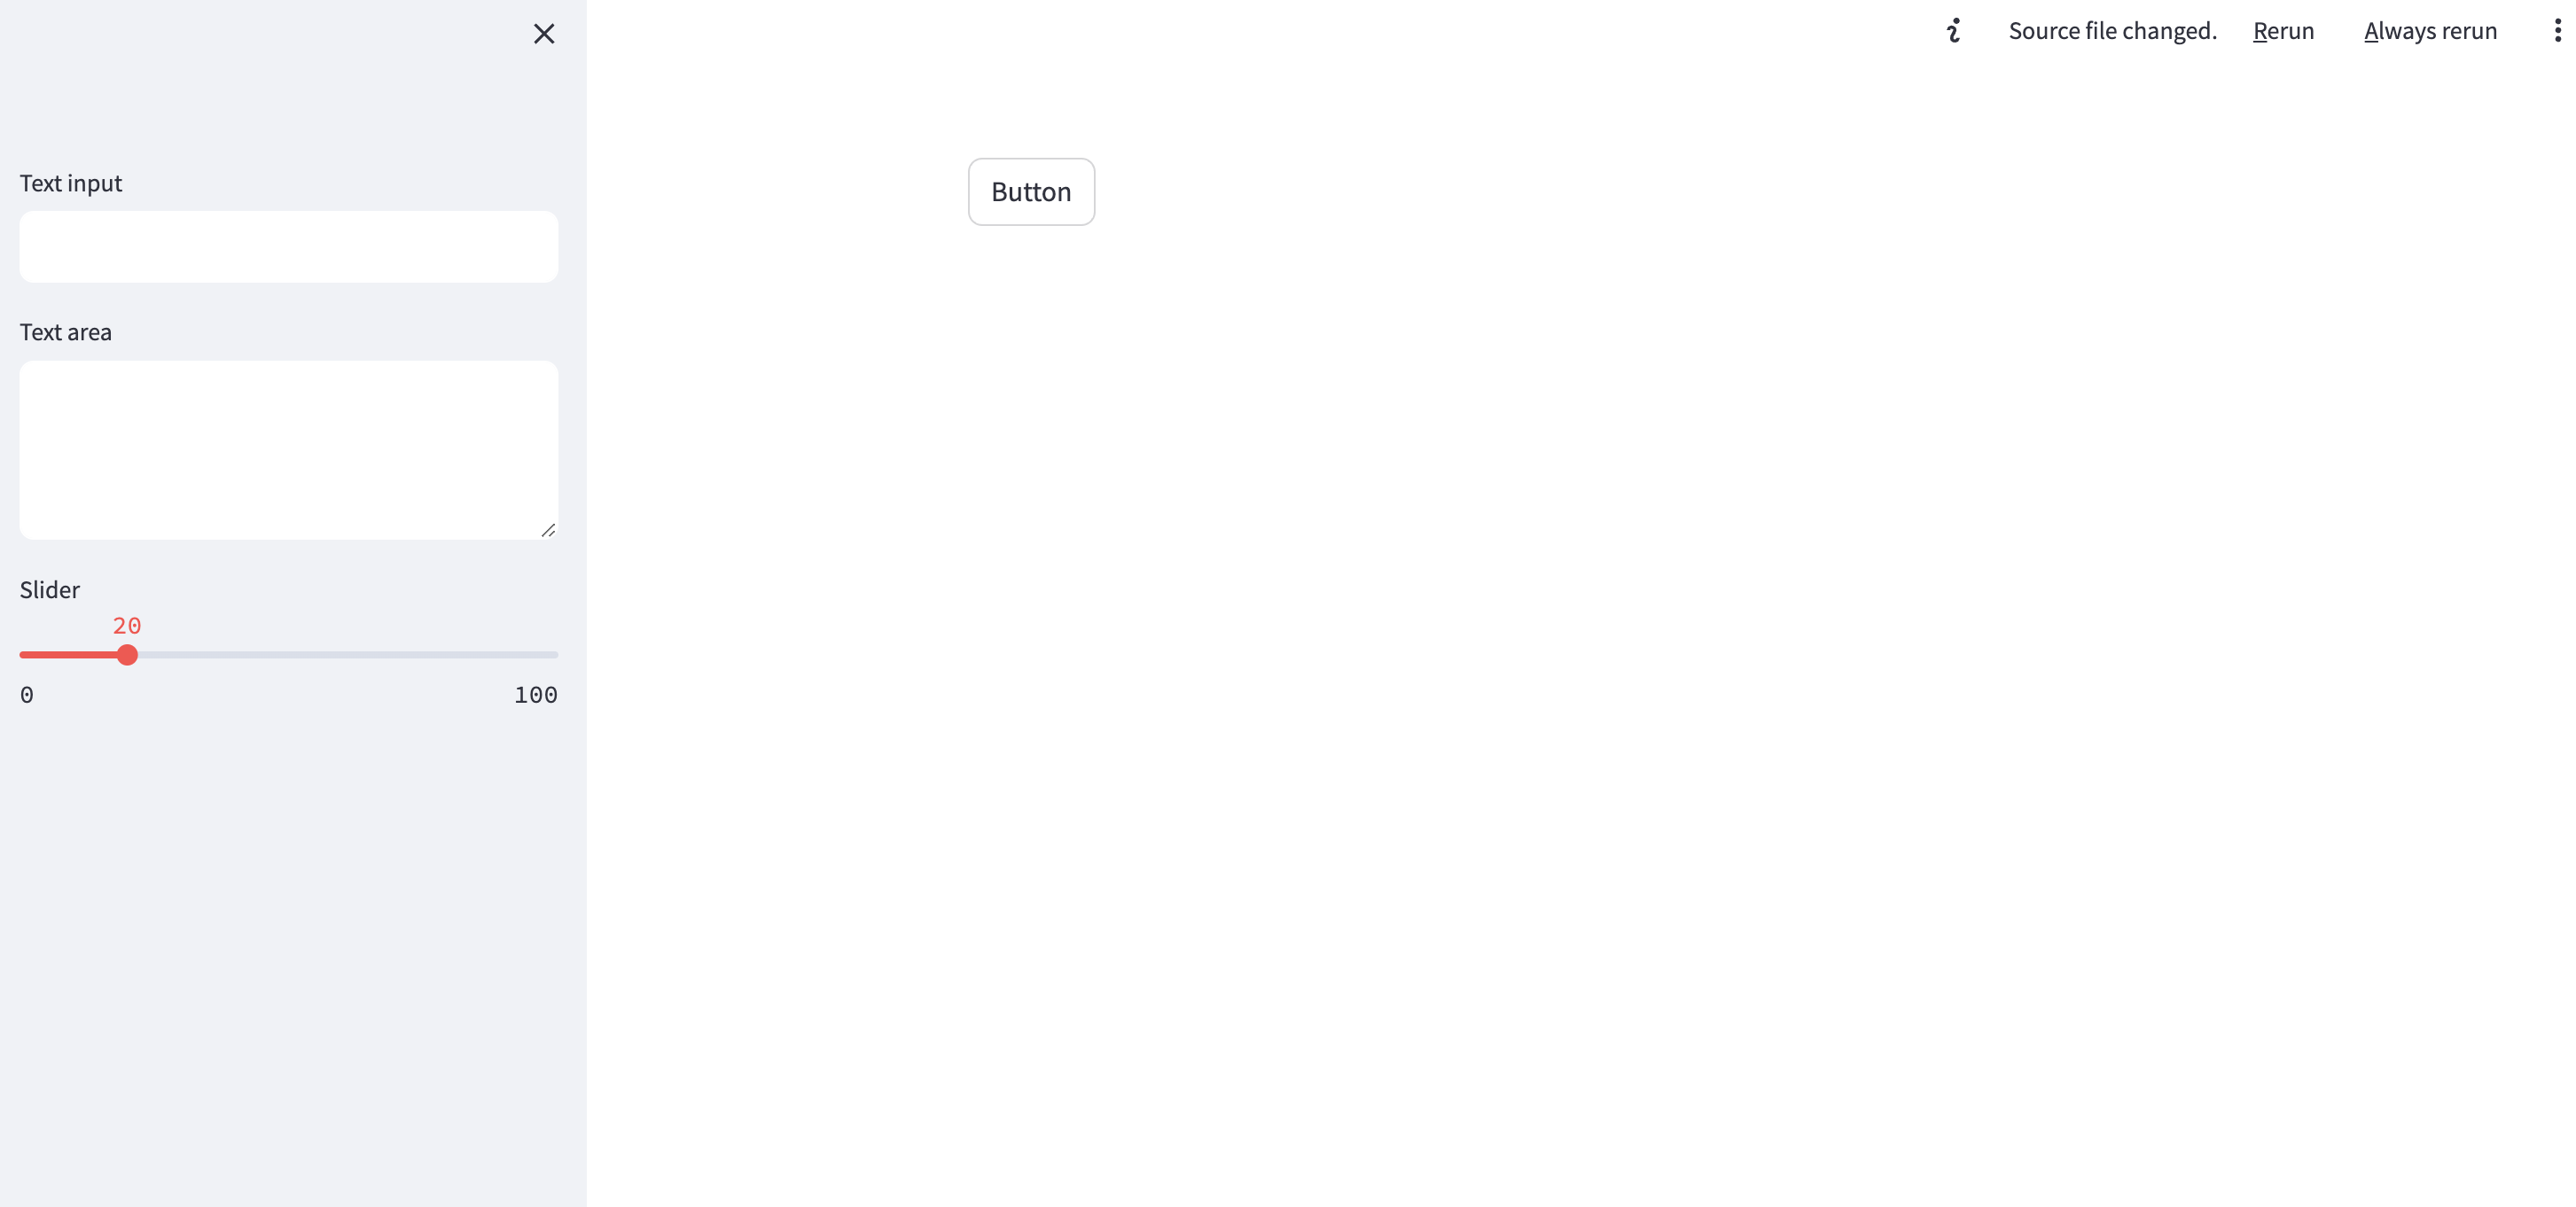
Sidebar
In Streamlit, apart from the main application area, you can use the sidebar to display widgets.
import streamlit as st

st.button("Button")

st.sidebar.text_input("Text input")
st.sidebar.text_area("Text area")
st.sidebar.slider("Slider", 0, 100, 20)
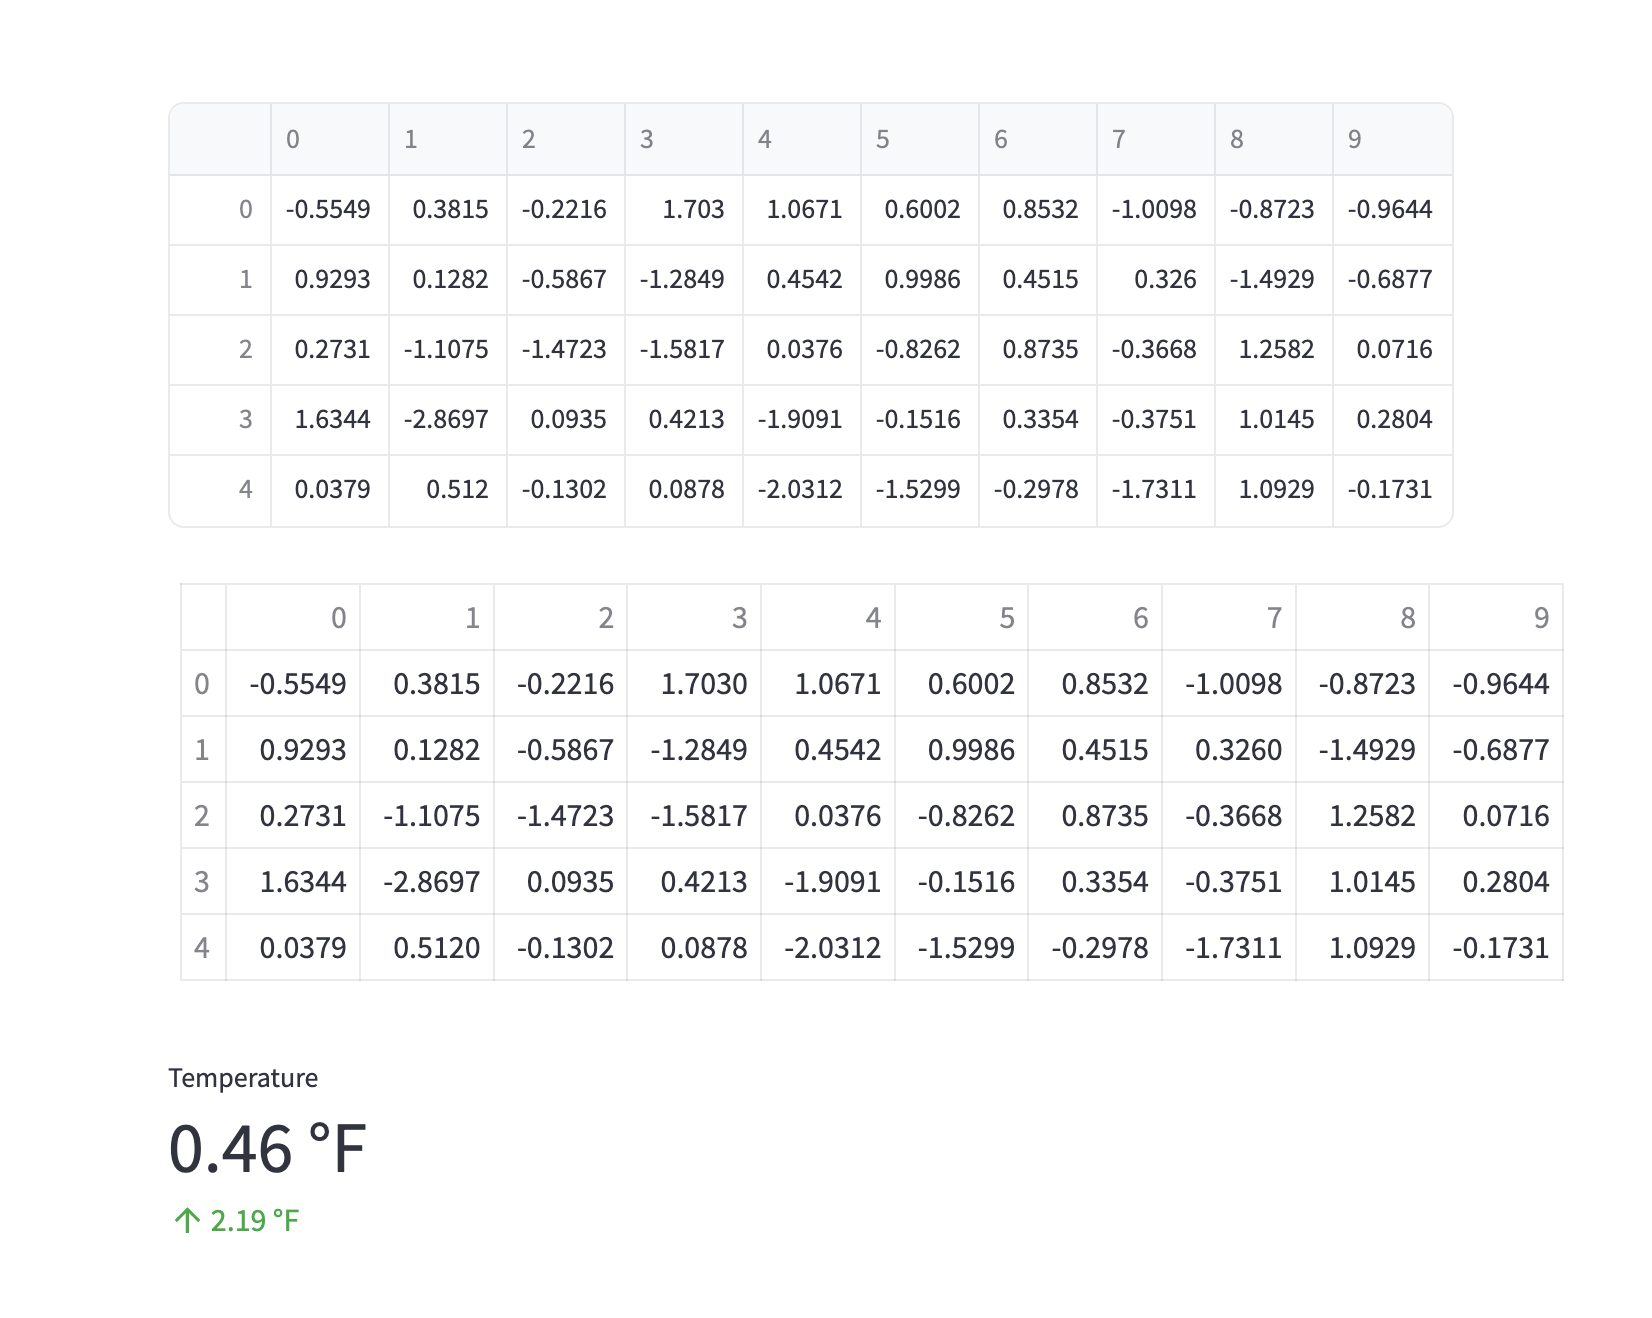
Table
Streamlit has built-in support for displaying Pandas DataFrames as formatted tables, making it easy to present data in tabular form.
import numpy as np
import pandas as pd

import streamlit as st

df = pd.DataFrame(np.random.randn(5, 10))
st.dataframe(df)  # Pandas dataframe
st.table(df)  # Table
st.metric(
    label="Temperature",
    value=f"{round(df[0].mean(), 2)} °F",
    delta=f"{round(df[0].max() - df[0].min(), 2)} °F",
)  # Metrics
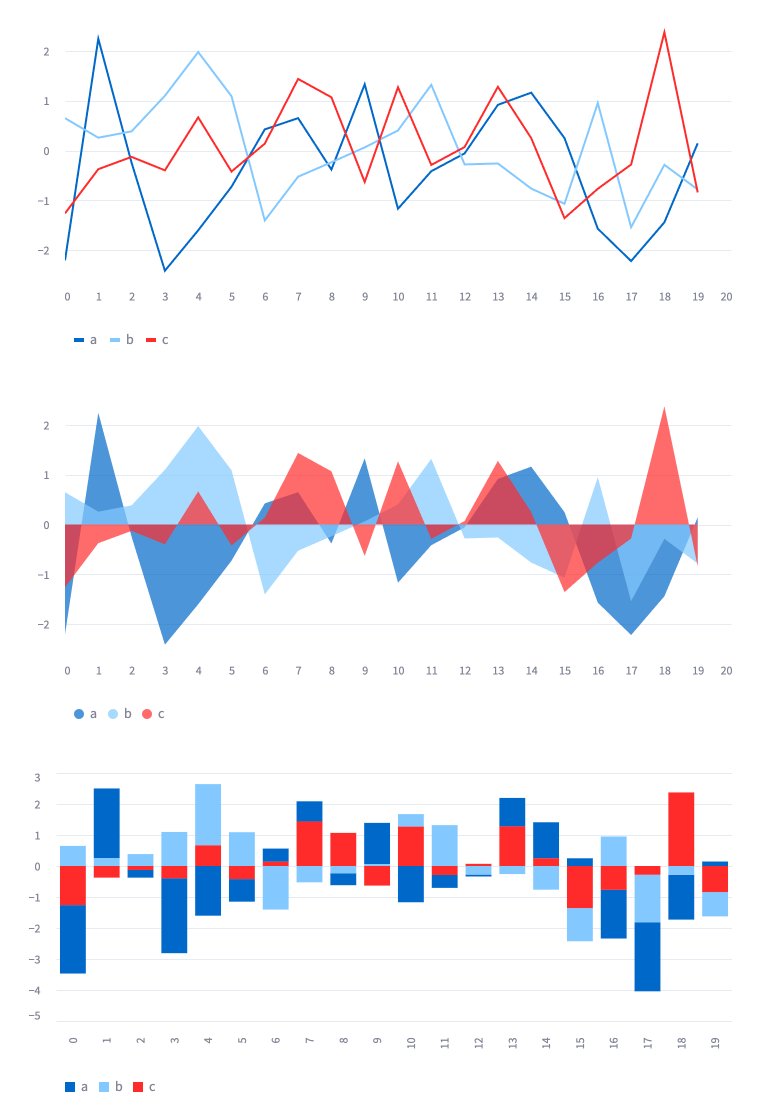
Graphs
You can use Streamlit to visualize data through graphs.
import streamlit as st
import pandas as pd
import numpy as np

dataframe = pd.DataFrame(np.random.randn(20,3), columns=["a", "b", "c"])
st.line_chart(dataframe) # Line
st.area_chart(dataframe) # Chart
st.bar_chart(dataframe) # Bar
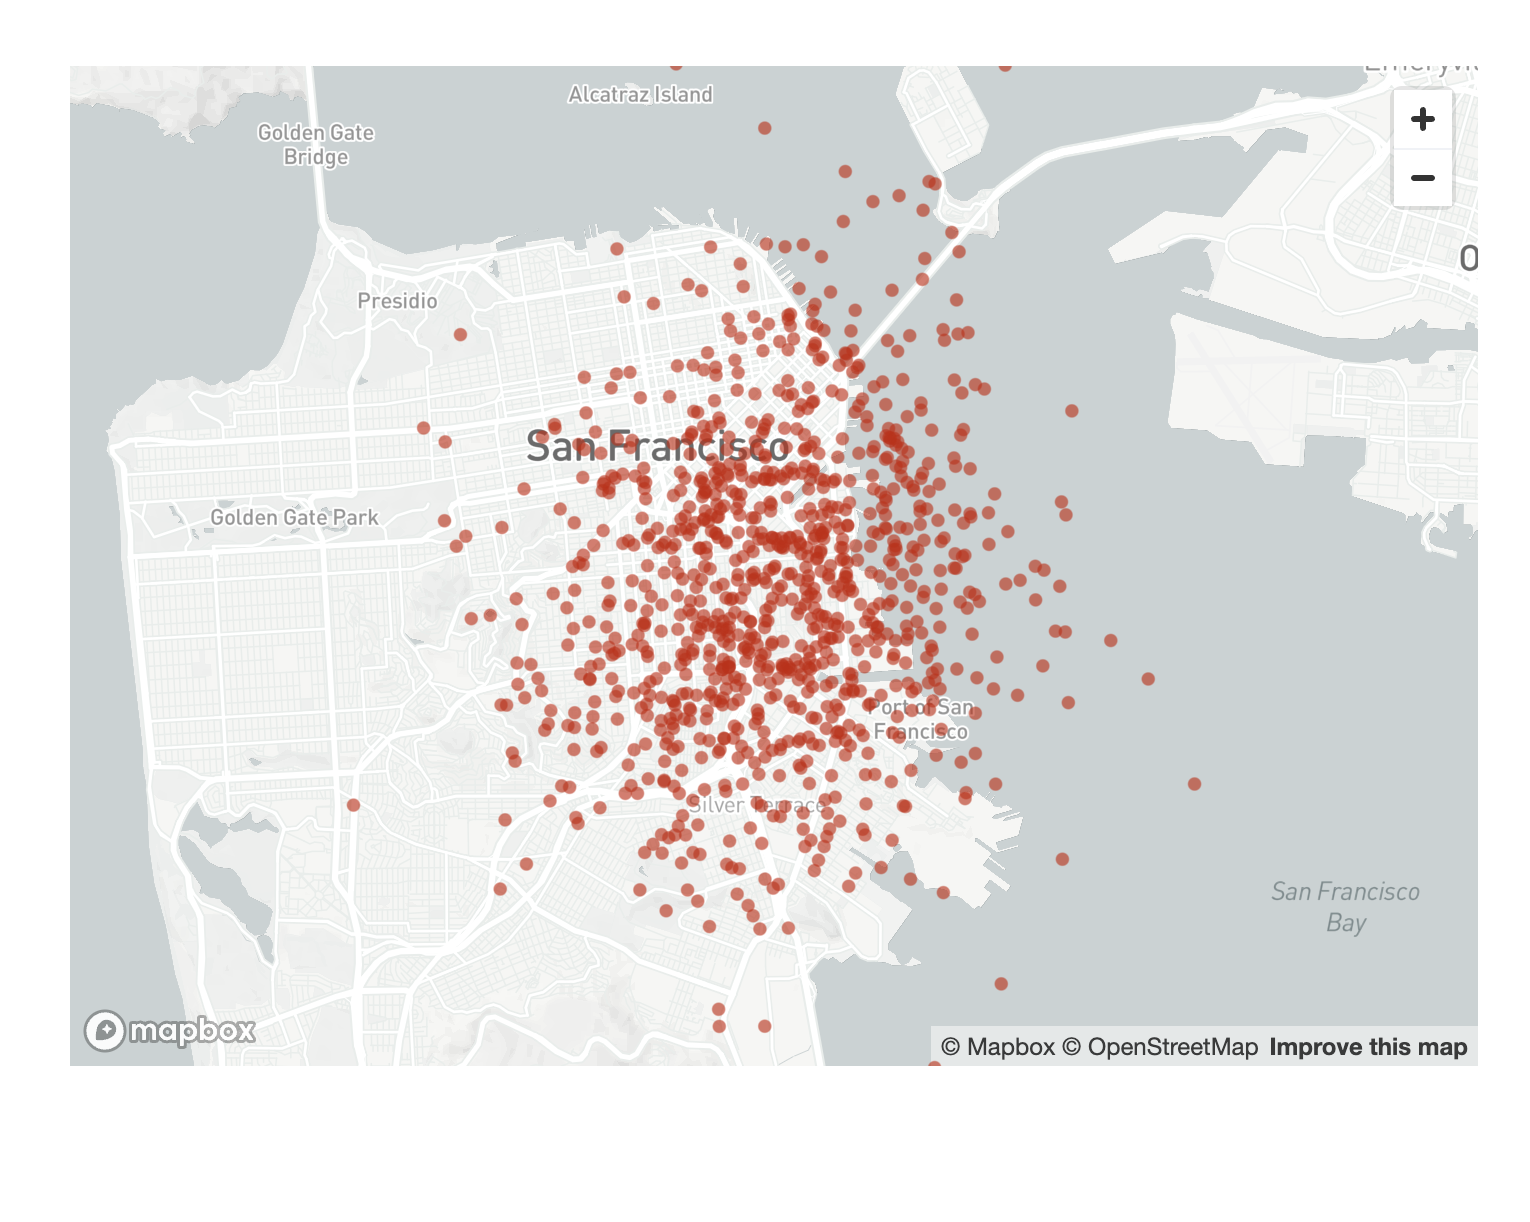
Maps
Streamlit provides built-in support for displaying geographical data.
import streamlit as st
import pandas as pd
import numpy as np

df = pd.DataFrame(
    np.random.randn(1000, 2) / [50, 50] + [37.76, -122.4],
    columns=['lat', 'lon'])
st.map(df)
References


Ryusei Kakujo


Weave the future of cities through data
Transportation modeling/ Urban planning/ Machine learning/ Computer science/ GIS