


Skewness of probability distribution
Skewness of a probability distribution is an indicator of the skewness (degree of asymmetry) of the distribution. Skewness of the distribution depends on the value as below:
skewness < 0
distribution is skewed to the right.skewness = 0
Distribution is symmetrical.skewness > 0
distribution is skewed to the left.
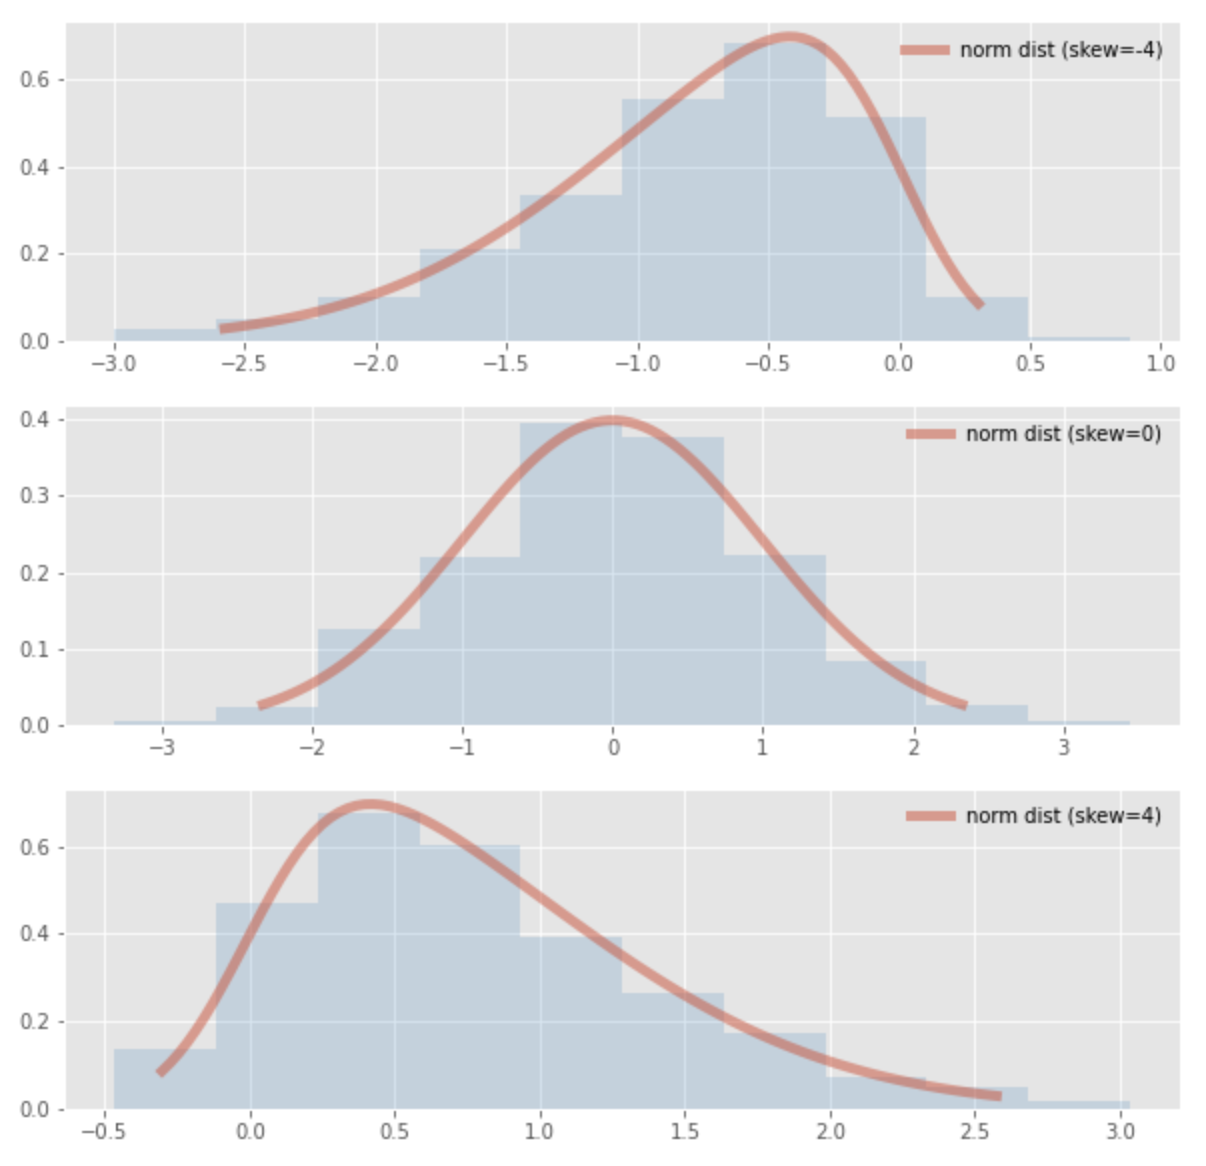
The figure below shows the standard normal distribution with varying skewness of the normal distribution.
In the case of normal distribution, skewness can be obtained by the following formula:
Kurtosis of probability distribution
The kurtosis of a probability distribution (Kurtosis) is a measure of the degree of sharpness or spread of the distribution with respect to the normal distribution. A distribution that is sharper than the normal distribution will have a positive kurtosis value, while a distribution that is slower than the normal distribution will have a negative kurtosis value.
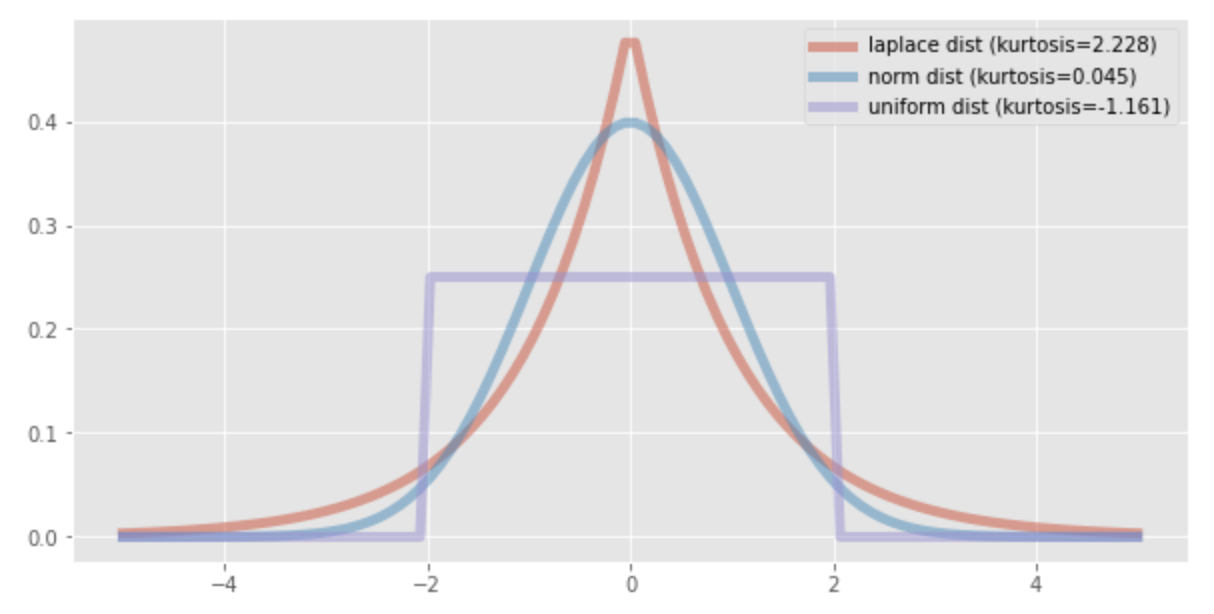
The figure below shows Laplace distribution with kurtosis of 2.228, normal distribution with kurtosis of 0.045, and uniform distribution with kurtosis of -1.161.
For a normal distribution, kurtosis can be obtained using the following formula:
Python Code
The Python codes for drawing the skewness and kurtosis of this probability distribution are shown below.
from scipy.stats import skewnorm
import matplotlib.pyplot as plt
import numpy as np

plt.style.use('ggplot')
fig, ax = plt.subplots(facecolor="w", figsize=(10, 10))

skews = [-4, 0, 4]

for i, skew in enumerate(skews):
    plt.subplot(3, 1, i+1)
    x = np.linspace(skewnorm.ppf(0.01, skew),
                    skewnorm.ppf(0.99, skew), 100)
    plt.plot(x, skewnorm.pdf(x, skew), lw=5, alpha=0.5, label=f'norm dist (skew={skew})')
    r = skewnorm.rvs(skew, size=1000)
    plt.hist(r, density=True, histtype='stepfilled', alpha=0.2)
    plt.legend(loc='best', frameon=False)
plt.show()
import matplotlib.pyplot as plt
import scipy.stats as stats
from scipy.stats import kurtosis

plt.style.use('ggplot')
fig, ax = plt.subplots(facecolor="w", figsize=(10, 5))

x = np.linspace(-5, 5, 100)
ax = plt.subplot()
distnames = ['laplace', 'norm', 'uniform']

for distname in distnames:
    if distname == 'uniform':
        dist = getattr(stats, distname)(loc=-2, scale=4)
    else:
        dist = getattr(stats, distname)
    data = dist.rvs(size=1000)
    kur = kurtosis(data, fisher=True)
    y = dist.pdf(x)
    ax.plot(x, y, lw=5, alpha=0.5, label="{} dist (kurtosis={})".format(distname, round(kur, 3)))
    ax.legend()
References


Ryusei Kakujo


Weave the future of cities through data
Transportation modeling/ Urban planning/ Machine learning/ Computer science/ GIS