


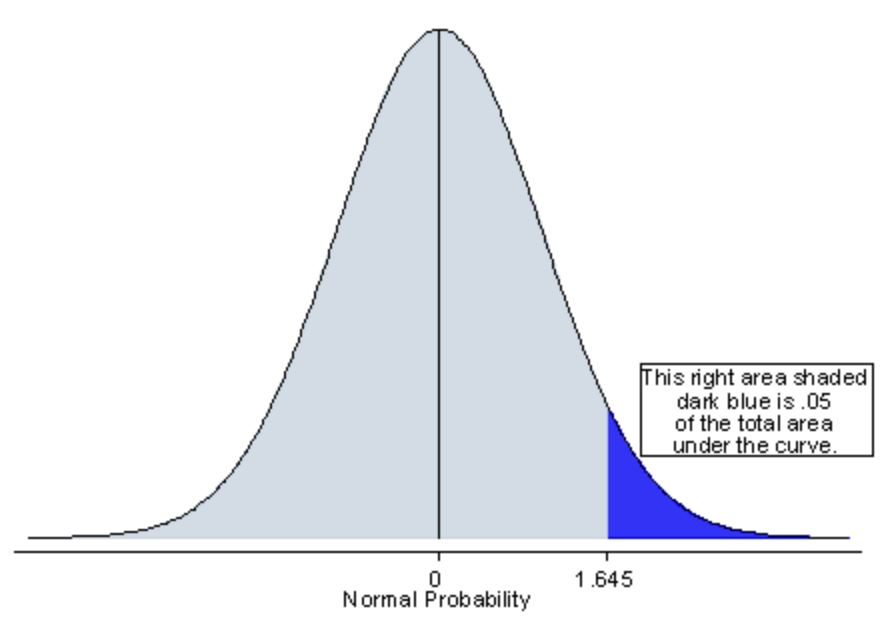
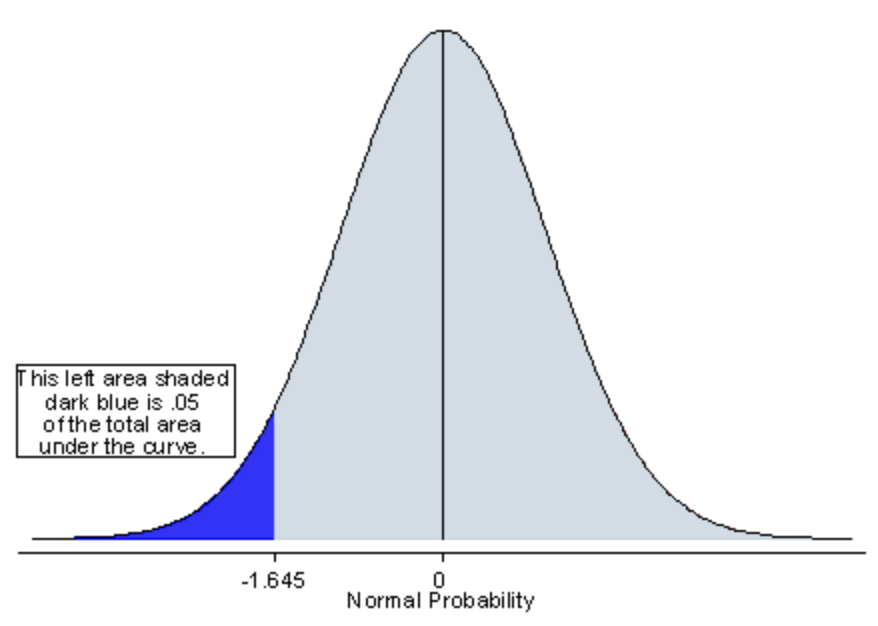
One-Tailed Test
A one-tailed test is a type of hypothesis test where the region of rejection is on only one side of the sampling distribution.
FAQ: WHAT ARE THE DIFFERENCES BETWEEN ONE-TAILED AND TWO-TAILED TESTS?
FAQ: WHAT ARE THE DIFFERENCES BETWEEN ONE-TAILED AND TWO-TAILED TESTS?
Imagine you're a researcher who believes that a modification in the manufacturing process of a product will increase its durability. In this case, you're not concerned about the modification reducing durability; you're only interested in the increase. To test your hypothesis, you'd use a one-tailed test.
The null hypothesis (
The choice of a one-tailed test is justified when the direction of the effect is predicted beforehand, based on theory, past research, or practical considerations.
Significance Level
In a one-tailed test, the entire significance level
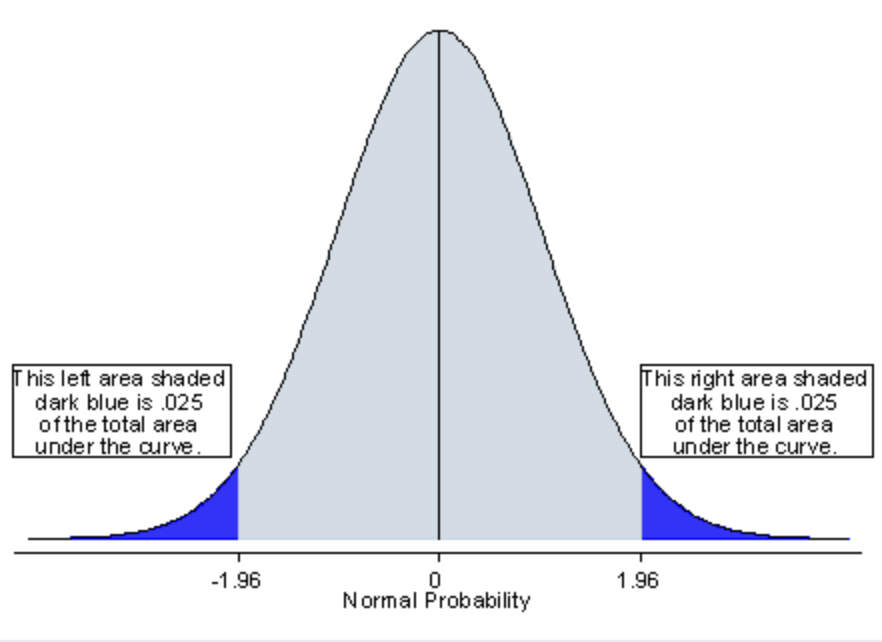
Two-Tailed Test
On the other hand, a two-tailed test is a method in which the area of rejection is on both sides of the sampling distribution. This means you're testing for the possibility of the relationship in both directions.
FAQ: WHAT ARE THE DIFFERENCES BETWEEN ONE-TAILED AND TWO-TAILED TESTS?
For example, suppose you're a scientist studying the effect of a new drug on blood pressure. You suspect that the drug could either increase or decrease blood pressure, and you're interested in either outcome. In this case, a two-tailed test would be suitable.
The null hypothesis (
The choice of a two-tailed test is appropriate when the direction of the effect is not known or is not a consideration in the context of the research question.
Significance Level
With a two-tailed test, the significance level
Example: Implementing One and Two-Tailed Tests
To better illustrate the concepts of one-tailed and two-tailed tests, let's consider a practical example. Imagine you are a researcher investigating the effects of a new teaching method on students' math scores.
Formulating Research Question
The research question is:
Does the new teaching method have an effect on students' math scores?
Choosing Hypothesis Test
Based on the research question, we must choose between a one-tailed and two-tailed test. Suppose you have no prior knowledge or expectations about the direction of the effect (i.e., whether the new teaching method will improve or worsen math scores). In this case, a two-tailed test would be appropriate.
Setting Up Hypotheses
For the two-tailed test, the null hypothesis (H0) is that the new teaching method has no effect on students' math scores, while the alternative hypothesis (H1) is that the new teaching method has an effect on students' math scores (either increasing or decreasing).
Now, imagine you have prior knowledge or a strong theoretical reason to believe that the new teaching method will improve students' math scores. In this case, a one-tailed test would be suitable.
For the one-tailed test, the null hypothesis (
Conducting Statistical Analysis
After collecting data from two groups of students—one group taught using the new method and another group taught using the traditional method—you perform the appropriate statistical test.
If you chose the two-tailed test, you would look for any significant differences in math scores between the two groups, regardless of the direction of the effect. A significant result would suggest that the new teaching method has an effect on math scores, either positively or negatively.
If you chose the one-tailed test, you would look for a significant increase in math scores in the group taught using the new method compared to the traditional method. A significant result would support the hypothesis that the new teaching method improves math scores.
Interpreting Results
After conducting the statistical analysis, you must interpret the results within the context of your research question and the chosen hypothesis test. If the results are significant, you can draw conclusions about the effect of the new teaching method on students' math scores. If the results are not significant, you cannot reject the null hypothesis and must conclude that there is insufficient evidence to support the alternative hypothesis.


Ryusei Kakujo


Weave the future of cities through data
Transportation modeling/ Urban planning/ Machine learning/ Computer science/ GIS