


What is Decision Tree
Decision trees are a powerful predictive modeling tool used for solving a wide range of classification and regression problems. They are simple yet effective, and their visual nature allows for easy interpretation and communication of results.
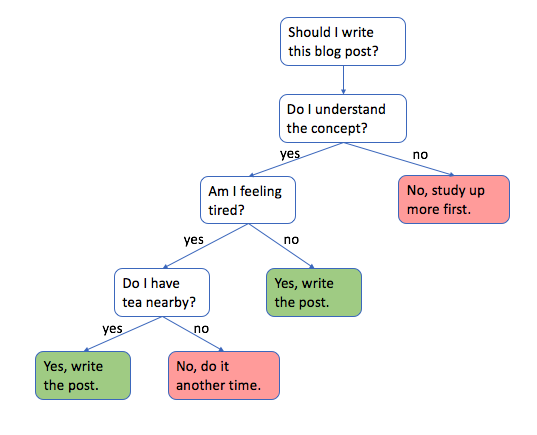
A decision tree is a flowchart-like structure in which internal nodes represent features or attributes, branches represent decision rules, and leaf nodes represent outcomes or decisions. The tree is built through a process called recursive binary splitting, which involves selecting the best attribute to split the dataset and then recursively repeating the process on the resulting subsets until certain stopping criteria are met.
Decision trees can be used in various applications, such as finance, healthcare, marketing, and fraud detection. By understanding how to build, interpret, and evaluate decision trees, one can make informed decisions based on the patterns and trends hidden within the data.
Building Decision Trees
In this chapter, I will explore the process of building decision trees, starting with the basic concept of recursive binary splitting and progressing to more advanced techniques for selecting the best split and pruning the tree. We will discuss various impurity measures, such as the Gini index and entropy, and how they impact the tree construction process.
Recursive Binary Splitting
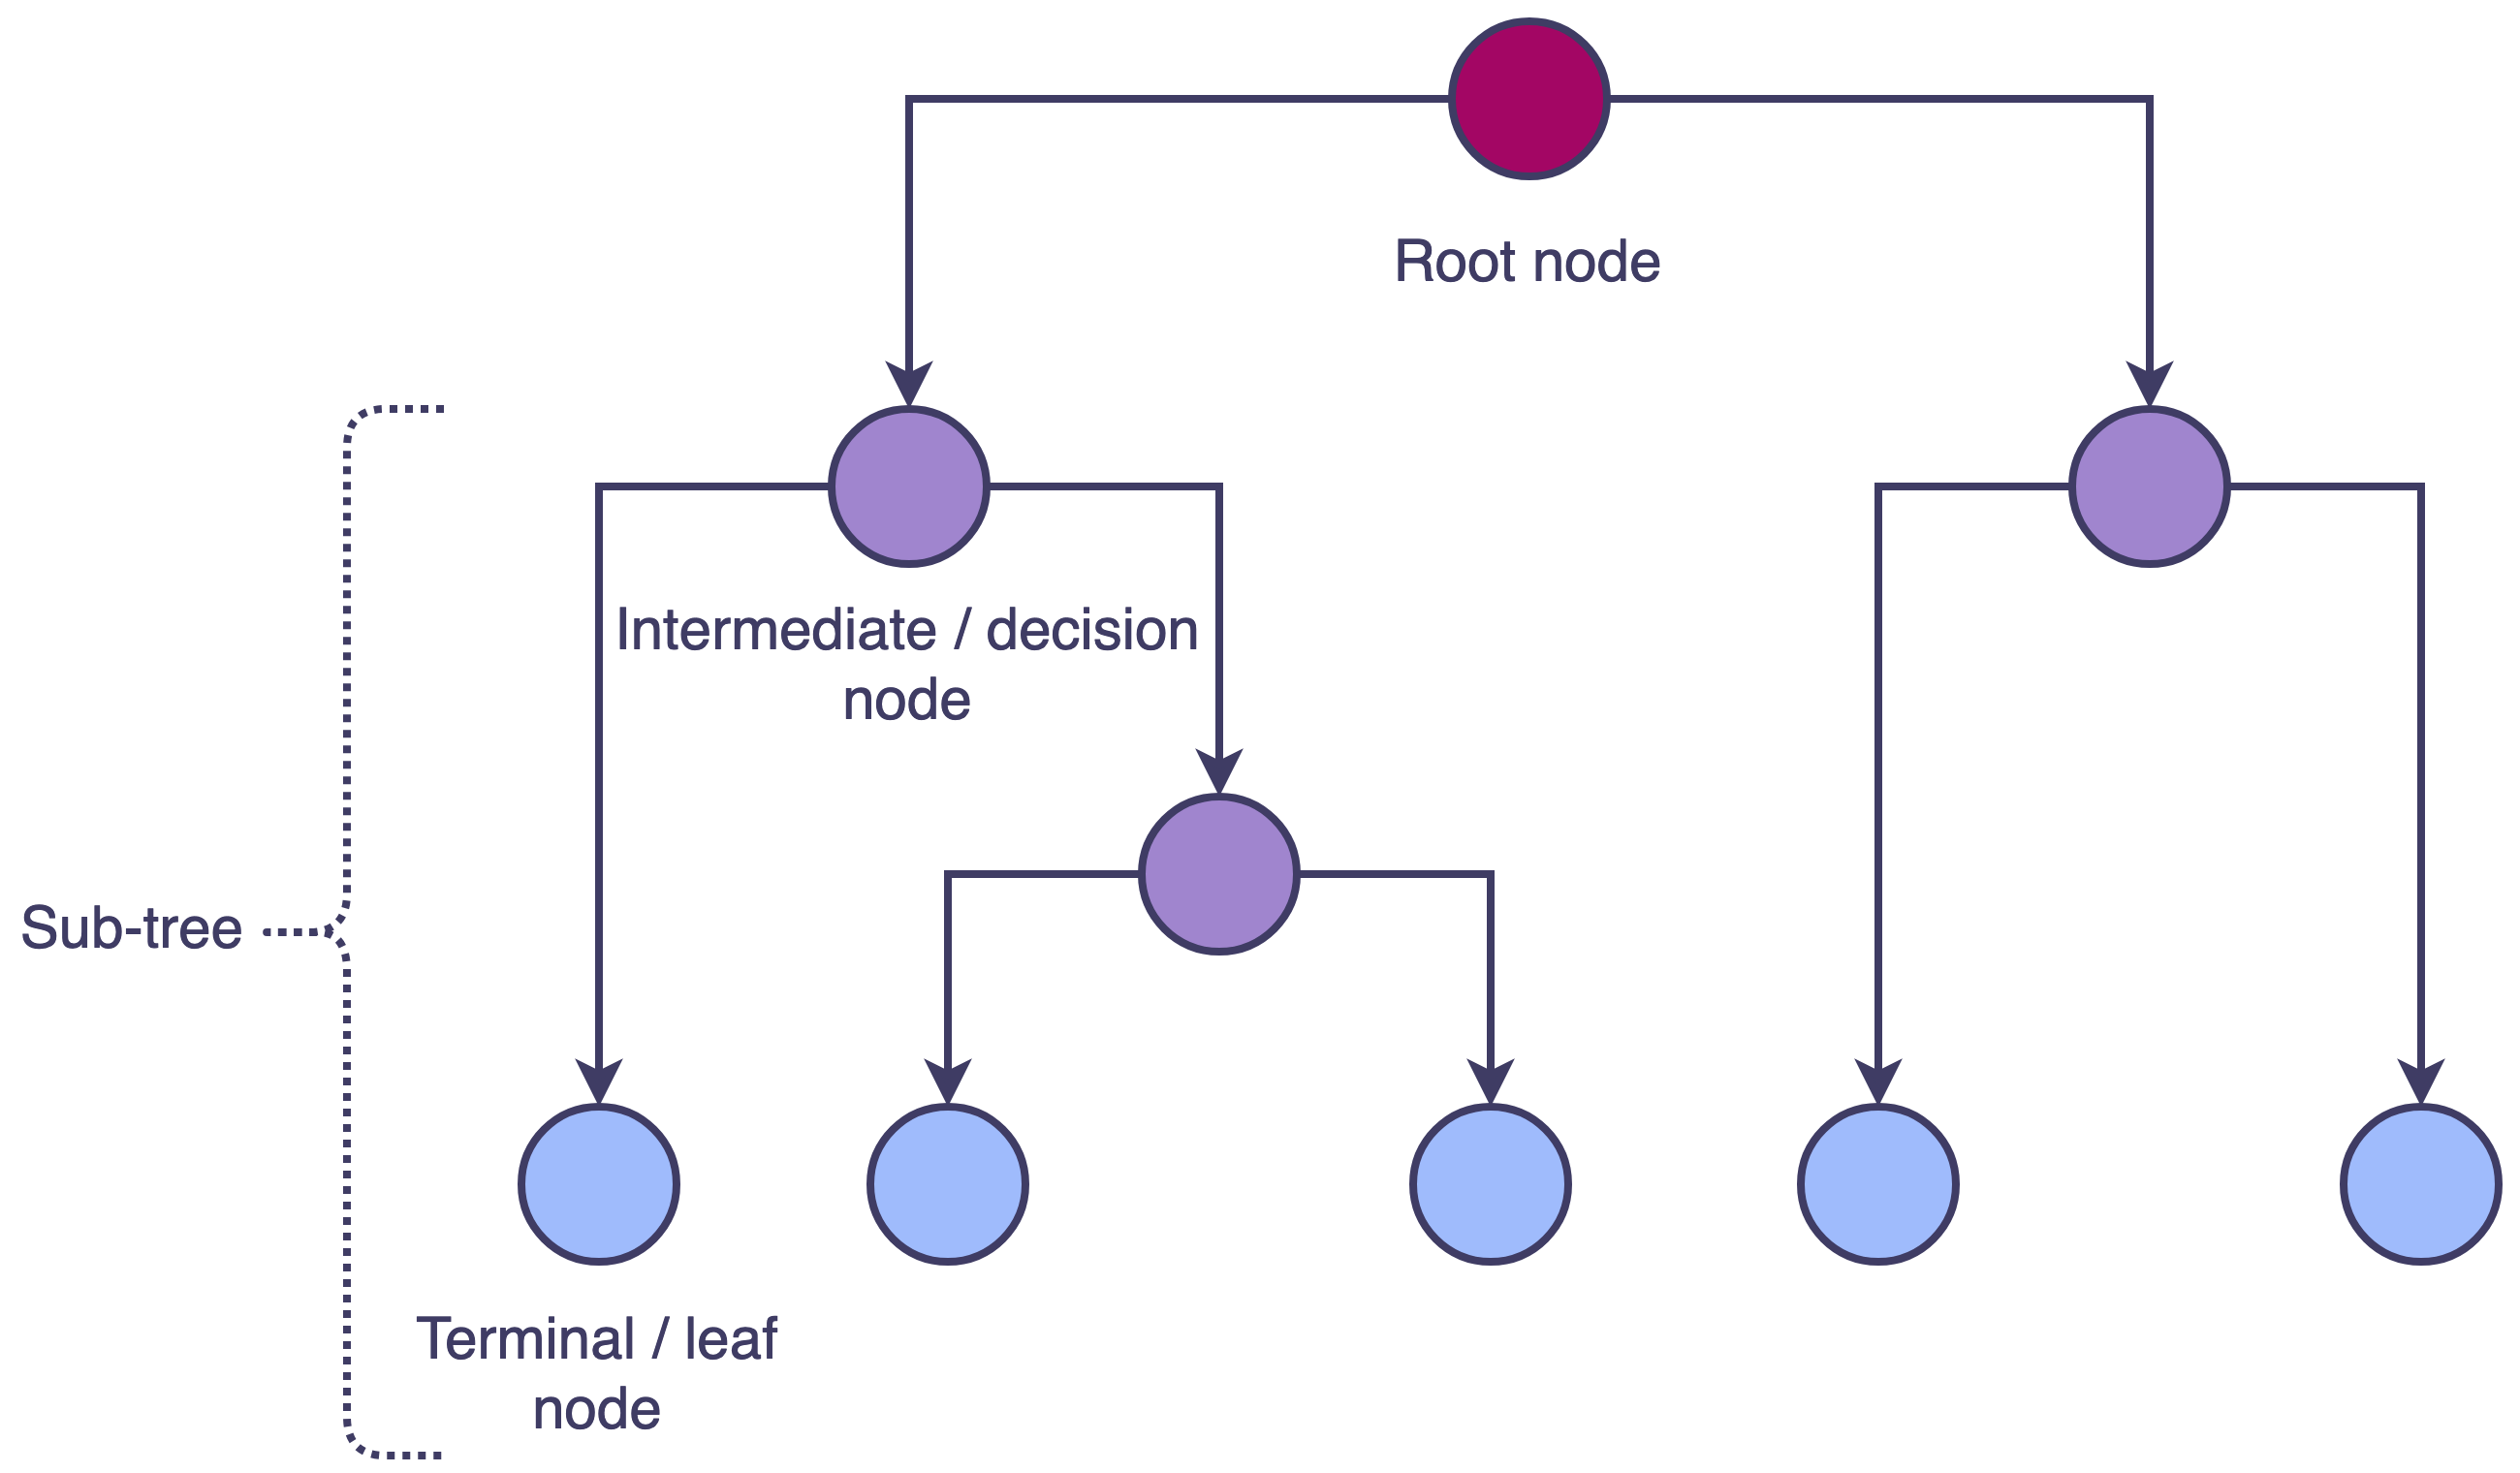
Recursive binary splitting is the primary method used to build decision trees. This process involves dividing the dataset into subsets based on the values of an input feature. It begins with the root node, which contains the entire dataset, and iteratively splits the data into two child nodes by choosing an attribute and a threshold value. This process continues recursively for each child node until a stopping criterion is met, resulting in a tree structure with decision nodes and leaf nodes.
An introduction to decision tree theory
Selecting the Best Split
The quality of a decision tree is highly dependent on the choice of attributes and thresholds used for splitting the data. To select the best split, we must evaluate the potential splits by measuring the impurity of the resulting child nodes. The goal is to minimize the impurity in the child nodes, thereby maximizing the information gain achieved through the split.
Information Gain
Information gain is a key concept in decision trees, used to determine the best attribute for splitting the data at each node. It measures the reduction in uncertainty or randomness after splitting the data based on a particular attribute. Information gain is calculated using entropy, a measure of the impurity or disorder within a dataset.
To calculate information gain, the entropy of the parent node is subtracted from the weighted average entropy of the child nodes created after the split. The attribute with the highest information gain is chosen as the splitting attribute at that node. This process is repeated for each subsequent node until the tree is fully grown.
Information Gain = Entropy(parent) - Weighted Average Entropy(children)
where
Entropy
Entropy is a measure of the impurity or disorder within a dataset, used primarily in the context of decision trees and information theory. It quantifies the uncertainty or randomness associated with the distribution of class labels in a dataset. In decision trees, entropy is used to calculate information gain, which in turn helps to determine the best attribute for splitting the data.
Entropy is calculated using the following formula:
where
Gini Index
The Gini index, also known as the Gini impurity or Gini coefficient, is another measure used to determine the best attribute for splitting the data in a decision tree. It quantifies the impurity or disorder within a dataset and, like information gain, helps to identify the most informative attribute for splitting.
The Gini index ranges from 0 to 1, with 0 representing perfect purity (all instances in the node belong to a single class) and 1 representing maximum impurity (instances are uniformly distributed across all classes). The attribute with the lowest Gini index is chosen as the splitting attribute at a given node.
where
Pruning the Tree
Decision trees can sometimes grow too large, leading to overfitting, which means the tree performs well on the training data but poorly on new, unseen data. Pruning is a technique used to reduce the size of the tree and mitigate overfitting. There are two primary pruning methods: pre-pruning and post-pruning.
-
Pre-pruning
Pre-pruning involves setting stopping criteria before the tree is fully grown, such as limiting the maximum depth of the tree or requiring a minimum number of samples in a leaf node. -
Post-pruning
Post-pruning involves growing the tree fully and then iteratively removing branches that do not contribute to the predictive accuracy of the tree. The most common post-pruning technique is cost-complexity pruning, which balances the error rate with the complexity of the tree.
Implementing Decision Trees in Python
In this chapter, I will demonstrate how to implement a decision tree classifier in Python using the machine learning library Scikit-learn. We will use the Iris dataset as an example, which is a multiclass classification problem.
Preparing Data
Before building the decision tree, it is essential to prepare the dataset. This step involves loading the data, splitting it into training and testing sets, and possibly preprocessing the data to handle missing values, categorical variables, or scaling features.
import pandas as pd
from sklearn.model_selection import train_test_split
from sklearn.datasets import load_iris

# Load dataset
iris = load_iris()
X = iris.data
y = iris.target

# Split data into training and testing sets
X_train, X_test, y_train, y_test = train_test_split(X, y, test_size=0.3, random_state=42)
Defining Model
Next, define the decision tree model using the DecisionTreeClassifier class from Scikit-learn. The DecisionTreeClassifier class allows you to customize the model by setting various hyperparameters that control the tree's growth and structure.
from sklearn.tree import DecisionTreeClassifier

# Define model
dtree = DecisionTreeClassifier(
  criterion='gini',
  max_depth=None,
  min_samples_split=2,
  min_samples_leaf=1,
  random_state=42
)
Here is a brief explanation of the main hyperparameters:
-
criterion
The criterion for measuring the impurity of a node. It can be either 'gini' for the Gini index or 'entropy' for entropy. The default value is 'gini'. -
max_depth
The maximum depth of the tree. If set toNone, the tree will expand until all leaves are pure or contain less thanmin_samples_splitsamples. Setting a maximum depth can help prevent overfitting. -
min_samples_split
The minimum number of samples required to split an internal node. If an internal node has fewer samples than this value, it will not be split, and the growth of the tree will be stopped. The default value is 2. -
min_samples_leaf
The minimum number of samples required to be at a leaf node. A split will only be considered if it leaves at leastmin_samples_leafsamples in each of the left and right branches. This hyperparameter can help prevent overfitting by ensuring that the tree does not create overly specific leaf nodes. The default value is 1. -
random_state
A seed for the random number generator used by the algorithm. By setting the random state, you can ensure that your decision tree model is reproducible. If set toNone, the model's results may vary between runs due to the randomness in the splitting process.
Training Model
Now, train the decision tree model on the training data.
# Train model
dtree.fit(X_train, y_train)
Predicting
Use the trained decision tree model to predict the class labels for the test data and evaluate the model's performance using metrics such as accuracy, precision, recall, and F1-score.
from sklearn.metrics import classification_report, accuracy_score

# Predict
y_pred = dtree.predict(X_test)

# Evaluate model performance
print("Accuracy:", accuracy_score(y_test, y_pred))
print(classification_report(y_test, y_pred))
Accuracy: 1.0
              precision    recall  f1-score   support

           0       1.00      1.00      1.00        19
           1       1.00      1.00      1.00        13
           2       1.00      1.00      1.00        13

    accuracy                           1.00        45
   macro avg       1.00      1.00      1.00        45
weighted avg       1.00      1.00      1.00        45
Visualizing Decision Tree
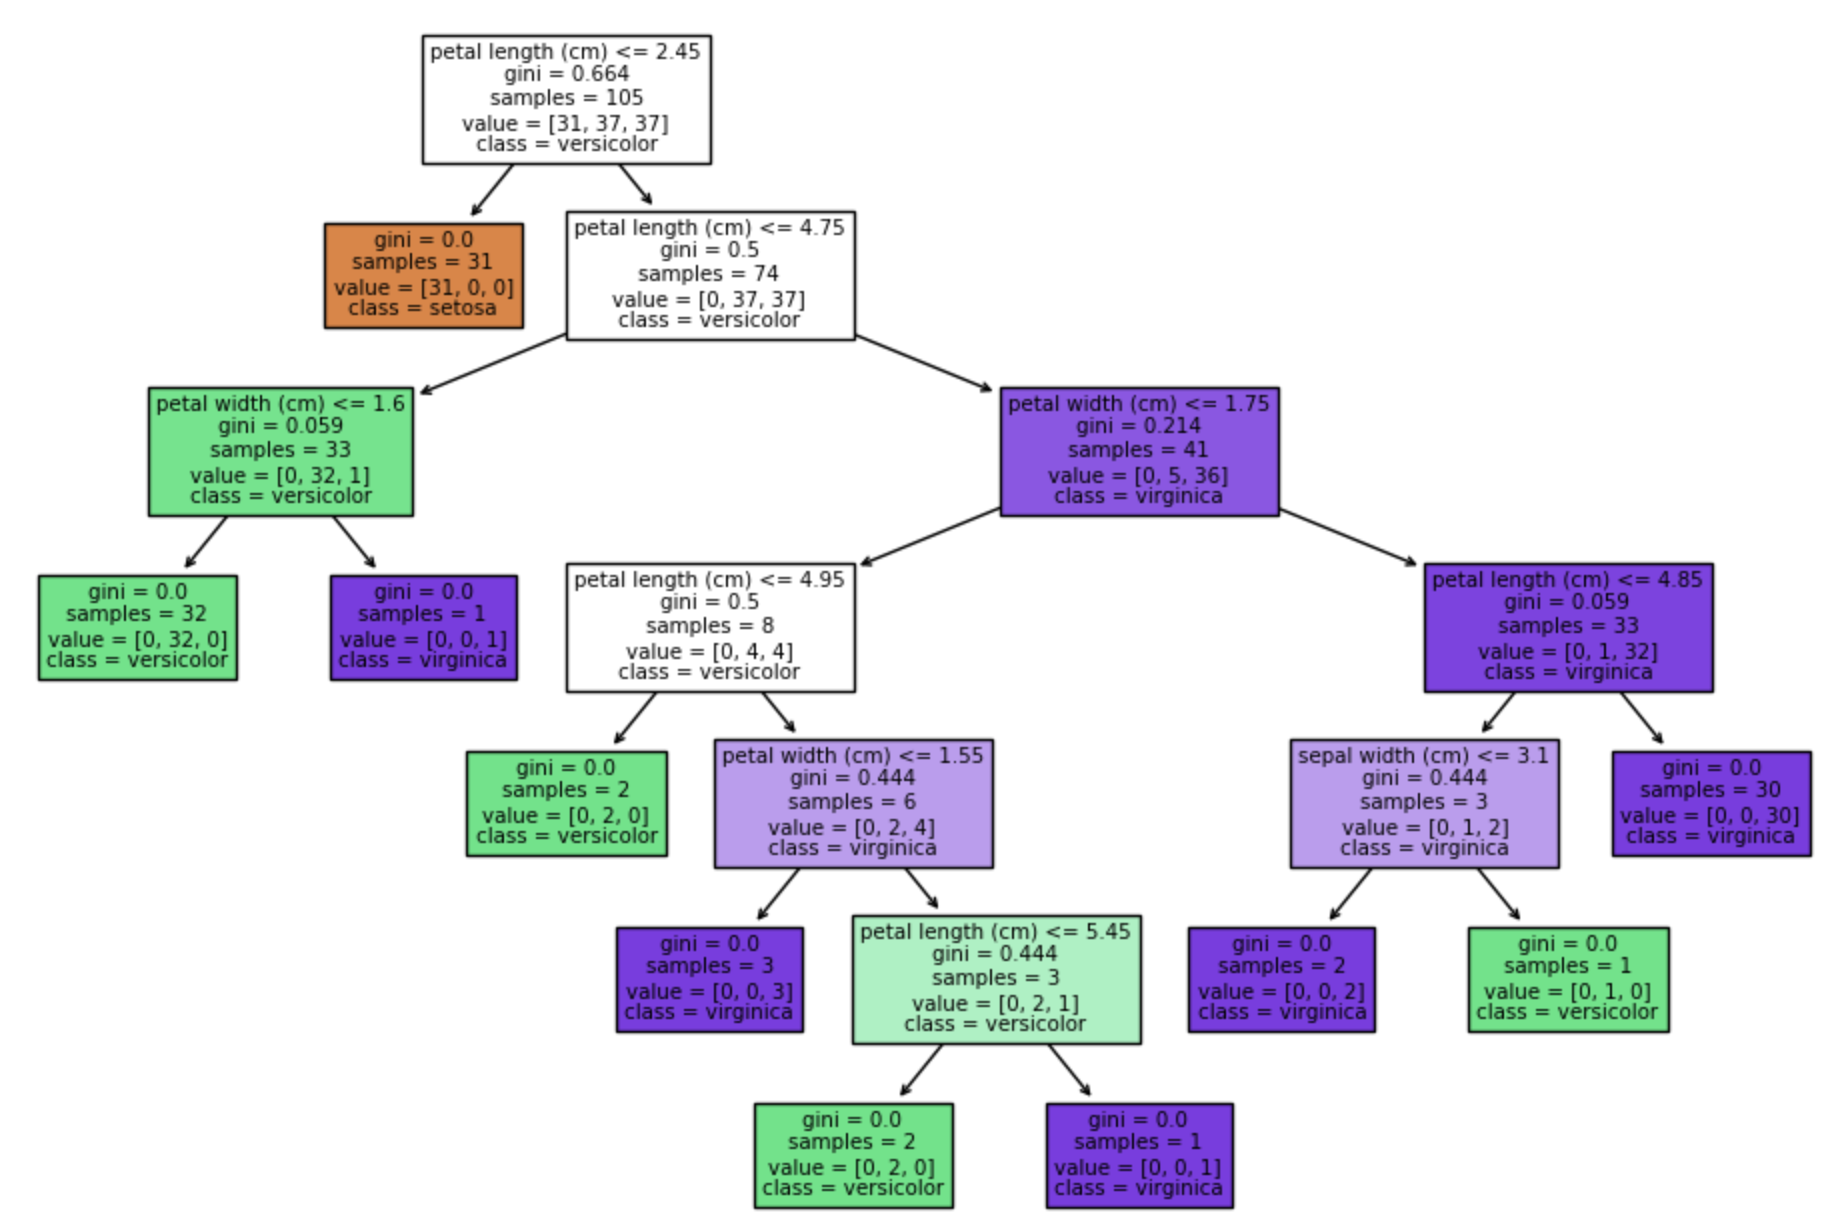
Visualizing the decision tree can help you understand how the model makes predictions and improve its interpretability. You can use the plot_tree function from Scikit-learn to create a graphical representation of the decision tree.
import matplotlib.pyplot as plt
from sklearn.tree import plot_tree

# Visualize decision tree
plt.figure(figsize=(12, 8))
plot_tree(dtree, filled=True, feature_names=iris.feature_names, class_names=iris.target_names)
plt.show()
References


Ryusei Kakujo


Weave the future of cities through data
Transportation modeling/ Urban planning/ Machine learning/ Computer science/ GIS