

What is QGIS
QGIS is open-source software specialized for Geographic Information Systems (GIS). Similar to many commercial GIS software, it allows visualization, editing, and analysis of geographic data, but its significant advantage lies in being freely available. QGIS is suitable for a wide range of users, from beginners to experts, due to its customizable plugins and features.
Functions of QGIS
Let's explain the main functions available in QGIS.
Data Visualization
-
Adding and Managing Layers
In QGIS, various types of geographic data layers (shapefiles, GeoJSON, KML, etc.) can be loaded and overlaid onto a map. This layer management feature is highly useful for analyzing and displaying multiple geographic datasets cohesively. -
Styling and Symbols
Beyond default representations, you can freely customize the styling (color, shape, size) of points, lines, and polygons. This enables visual representations tailored to the characteristics of the data. -
Map Output
By using the map output function, you can save generated maps as PDF or image files. Additionally, you can output them as interactive web maps.
Data Editing
-
Geometry Editing
You can edit the shapes (geometry) of basic geographic data such as points, lines, and polygons. This allows for correcting data collected during field surveys or creating new datasets. -
Attribute Editing
Attributes associated with geographic data (e.g., names, categories, numerical information) are also editable. This facilitates detailed data analysis and filtering.
Geographic Data Analysis
-
Buffer Creation
You can create a "buffer" that identifies objects within a certain distance from specified points or areas. This can be used, for example, to calculate the population living within 500 meters of a school. -
Spatial Join
Different geographic datasets can be joined based on spatial relationships. For instance, this can be used to calculate the number of parks in each postal code area. -
Layer Overlay
It's possible to overlay multiple geographic data layers to generate new layers. This allows for detailed analysis of relationships and impacts between different datasets.
Plugins and Extensions
-
Installing Plugins
QGIS offers numerous plugins that provide specialized functions for specific purposes or analysis methods. This diversity allows QGIS to be utilized in various specialized fields. -
Python Scripts
You can implement custom analysis procedures and automation using Python programming.
Applications of QGIS
Here are some examples of how QGIS is applied.
Local Government
-
Land Use Planning
QGIS is employed for formulating and adjusting land use plans. For instance, it's used to analyze which areas are suitable for housing, commercial, industrial, or agricultural purposes by overlaying existing land use data with future development plans. -
Disaster Preparedness
QGIS is utilized in disaster planning, including flood risk maps and landslide risk maps. These maps are often created using QGIS's advanced analytical capabilities and are sometimes made public.
Research Institutions
-
Environmental Studies
QGIS is commonly used for data analysis in environmental studies. Tasks include mapping specific vegetation or animal habitats, as well as analyzing water quality data in conjunction with geographic data. -
Social Sciences
QGIS finds application in social science research such as population statistics, election results, and traffic flow analysis. Analyzing variations across regions over time can yield valuable insights.
Corporations
-
Real Estate
Geographic data often plays a crucial role in assessing property values within the real estate industry. By using QGIS, one can conduct detailed analyses on the relationship between surrounding environments (e.g., public facilities, transportation networks, commercial establishments) and property prices. -
Retail Industry
QGIS is employed in the retail industry for determining the location of new stores and analyzing factors affecting the sales of existing stores. By considering factors like consumer residence, competitor store locations, and transportation access, comprehensive strategies can be devised. -
Agriculture
QGIS is also used in precision agriculture. It allows for comprehensive analysis of soil data, weather data, and crop growth data in an integrated manner.
Installing QGIS
Visit the following official website to download QGIS:
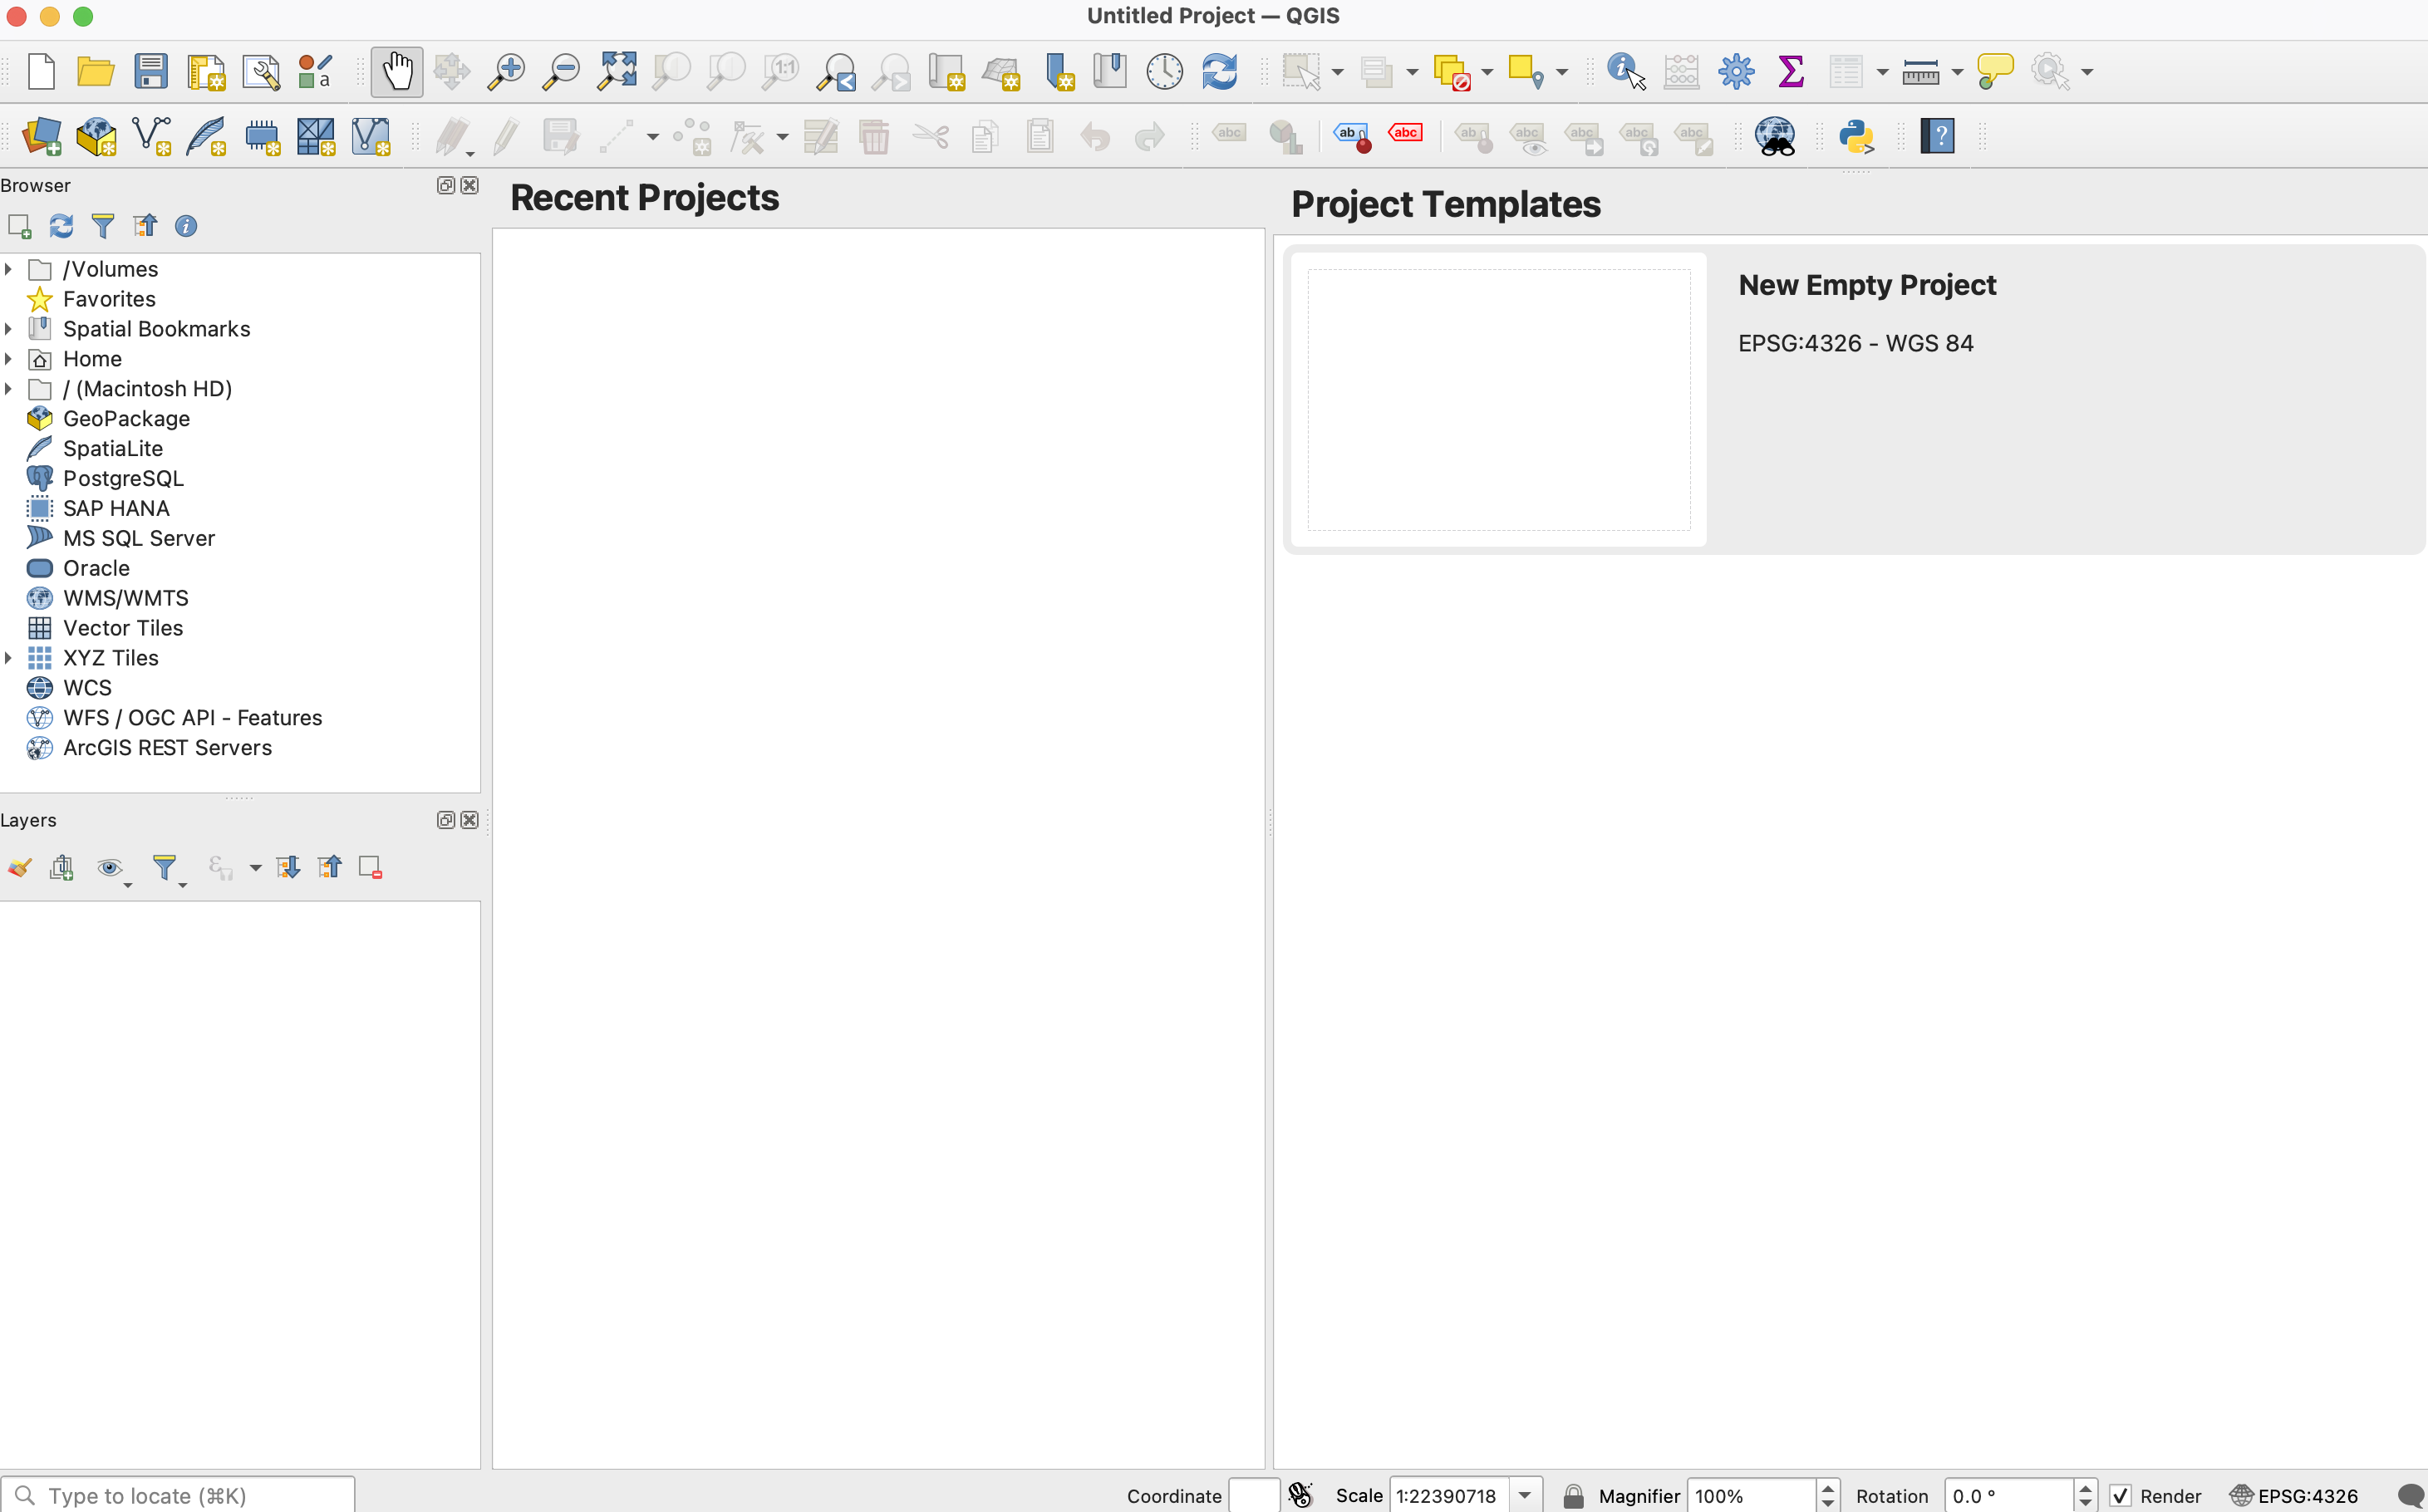
Once the download is complete and you launch the application, you will see a screen similar to the one below:
Loading Data
Let's load data and visualize it. We will use the dataset named tokyo.zip available at the following link:
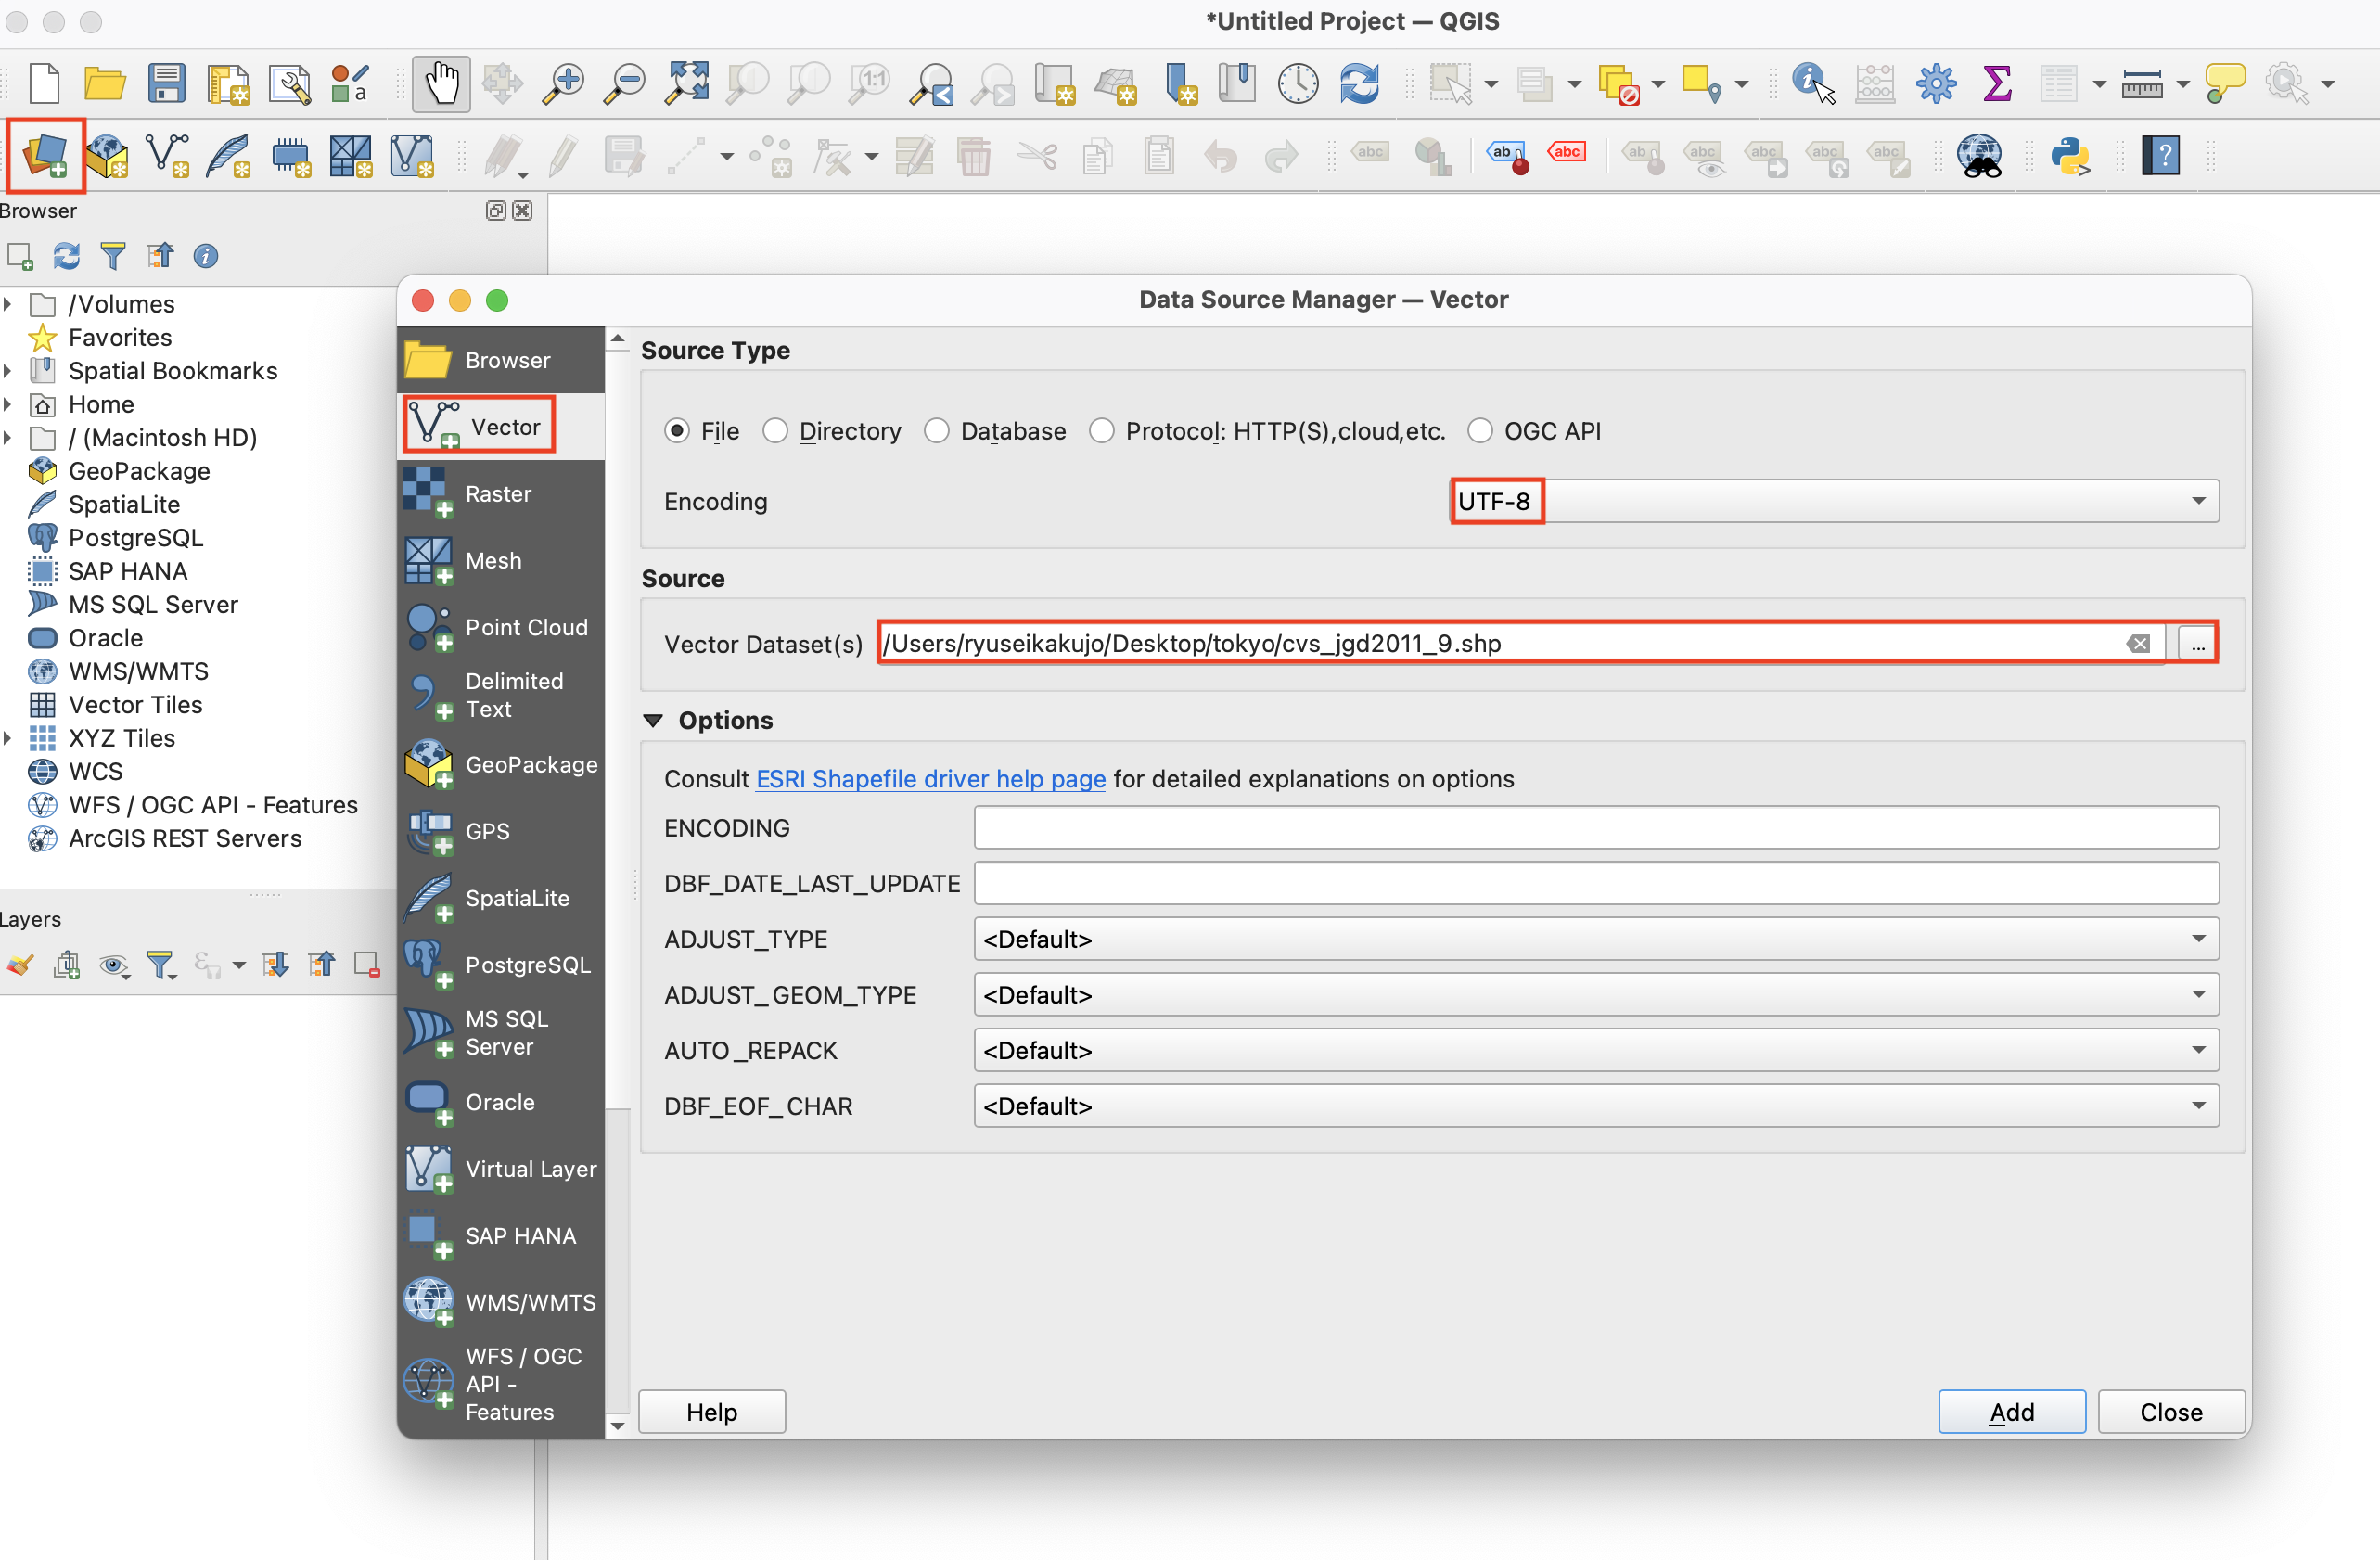
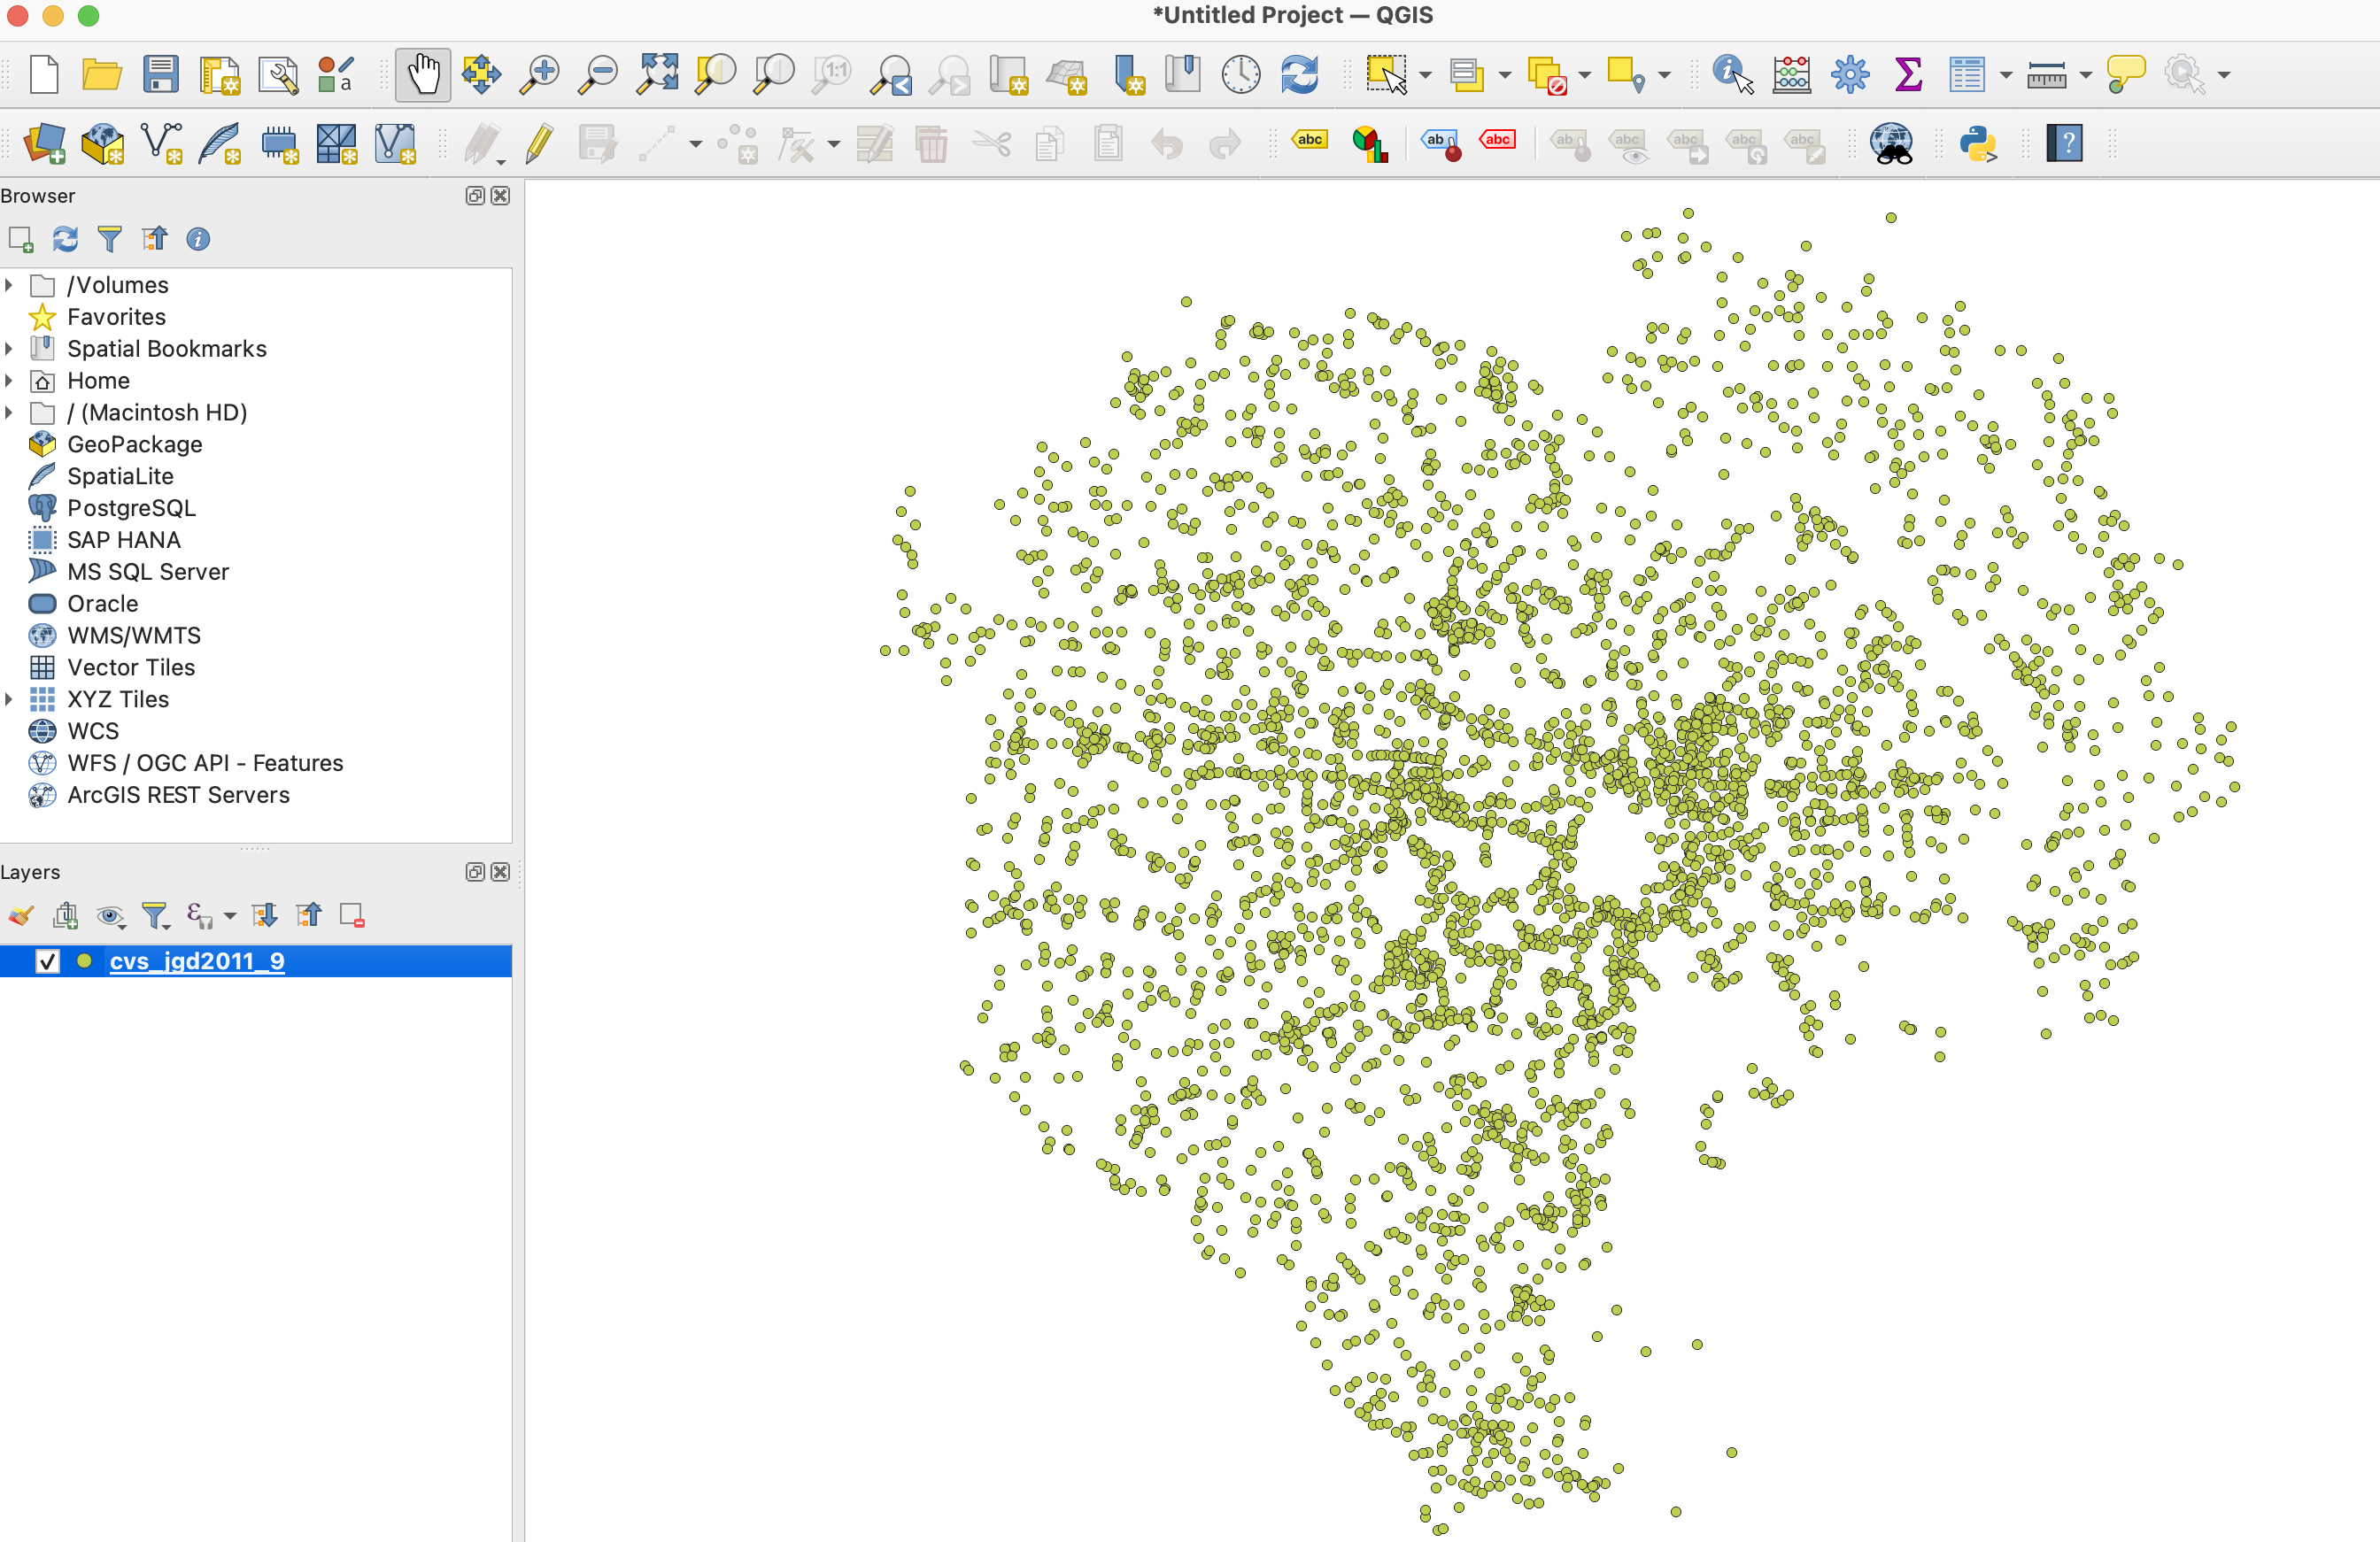
As shown in the capture below, load the vector data named cvs_jgd2011_9.shp.
This will display the locations of convenience stores in the 23 special wards of Tokyo.
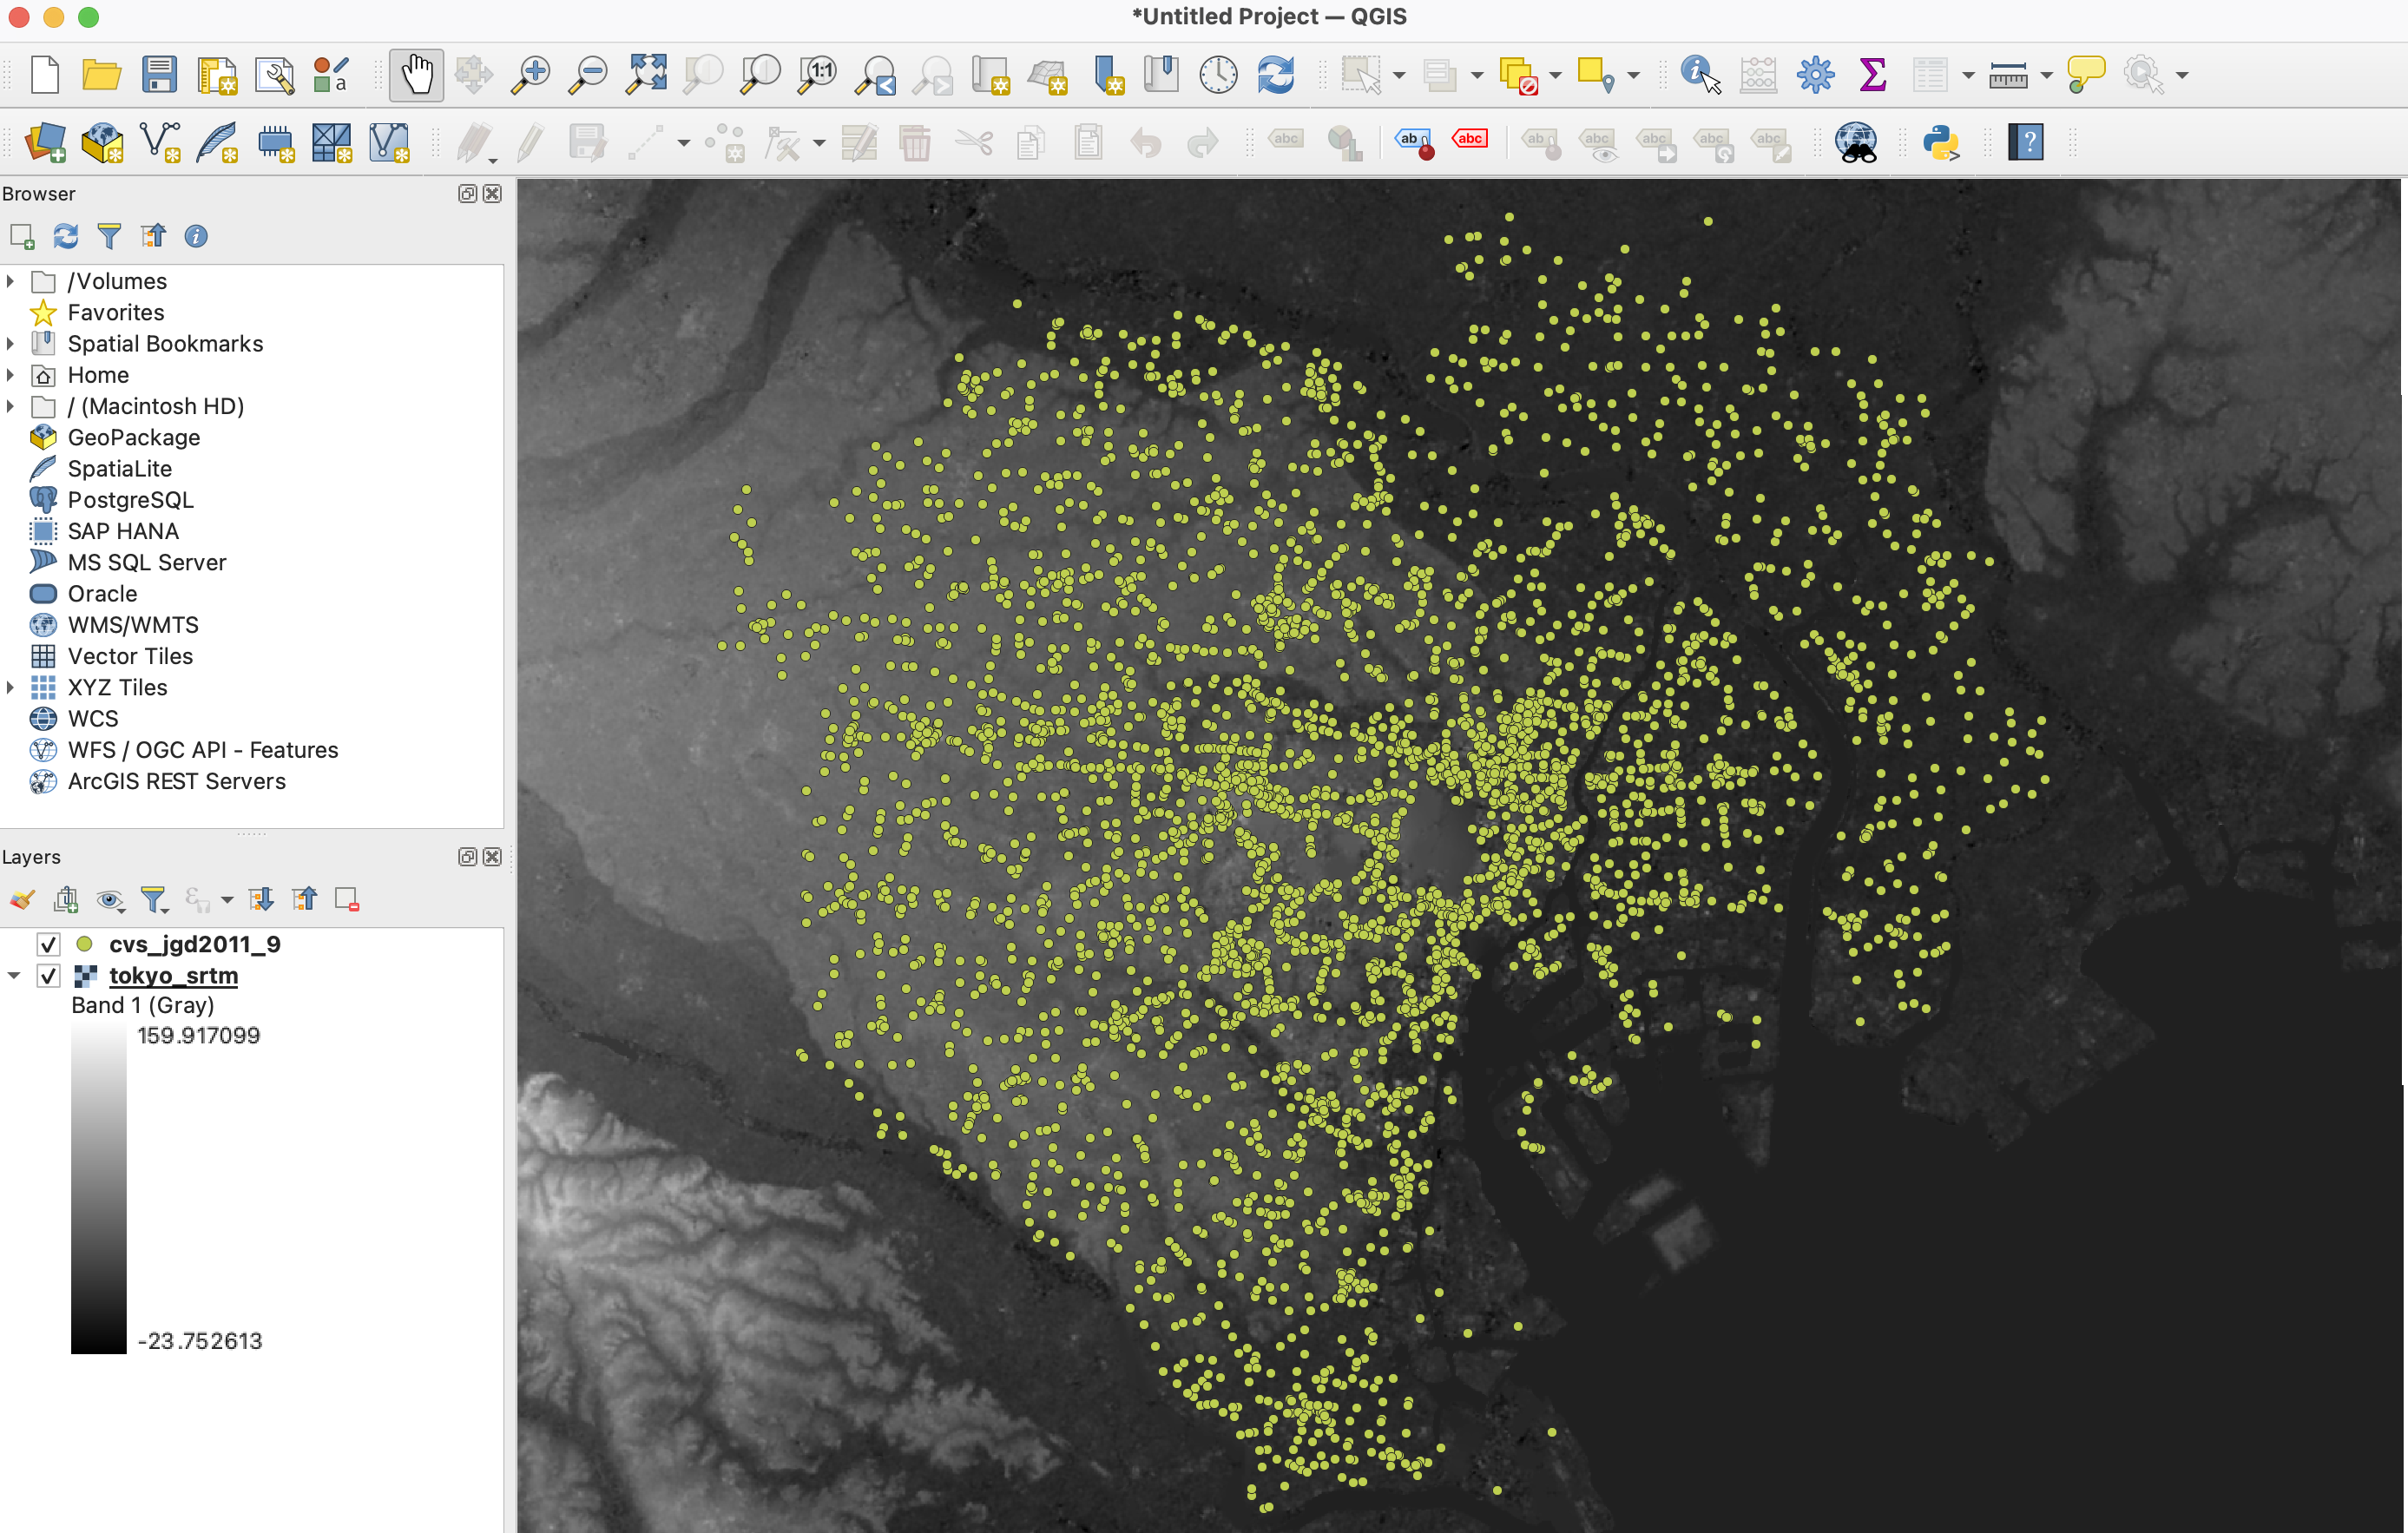
Load the raster data named tokyo_srtm.tif.
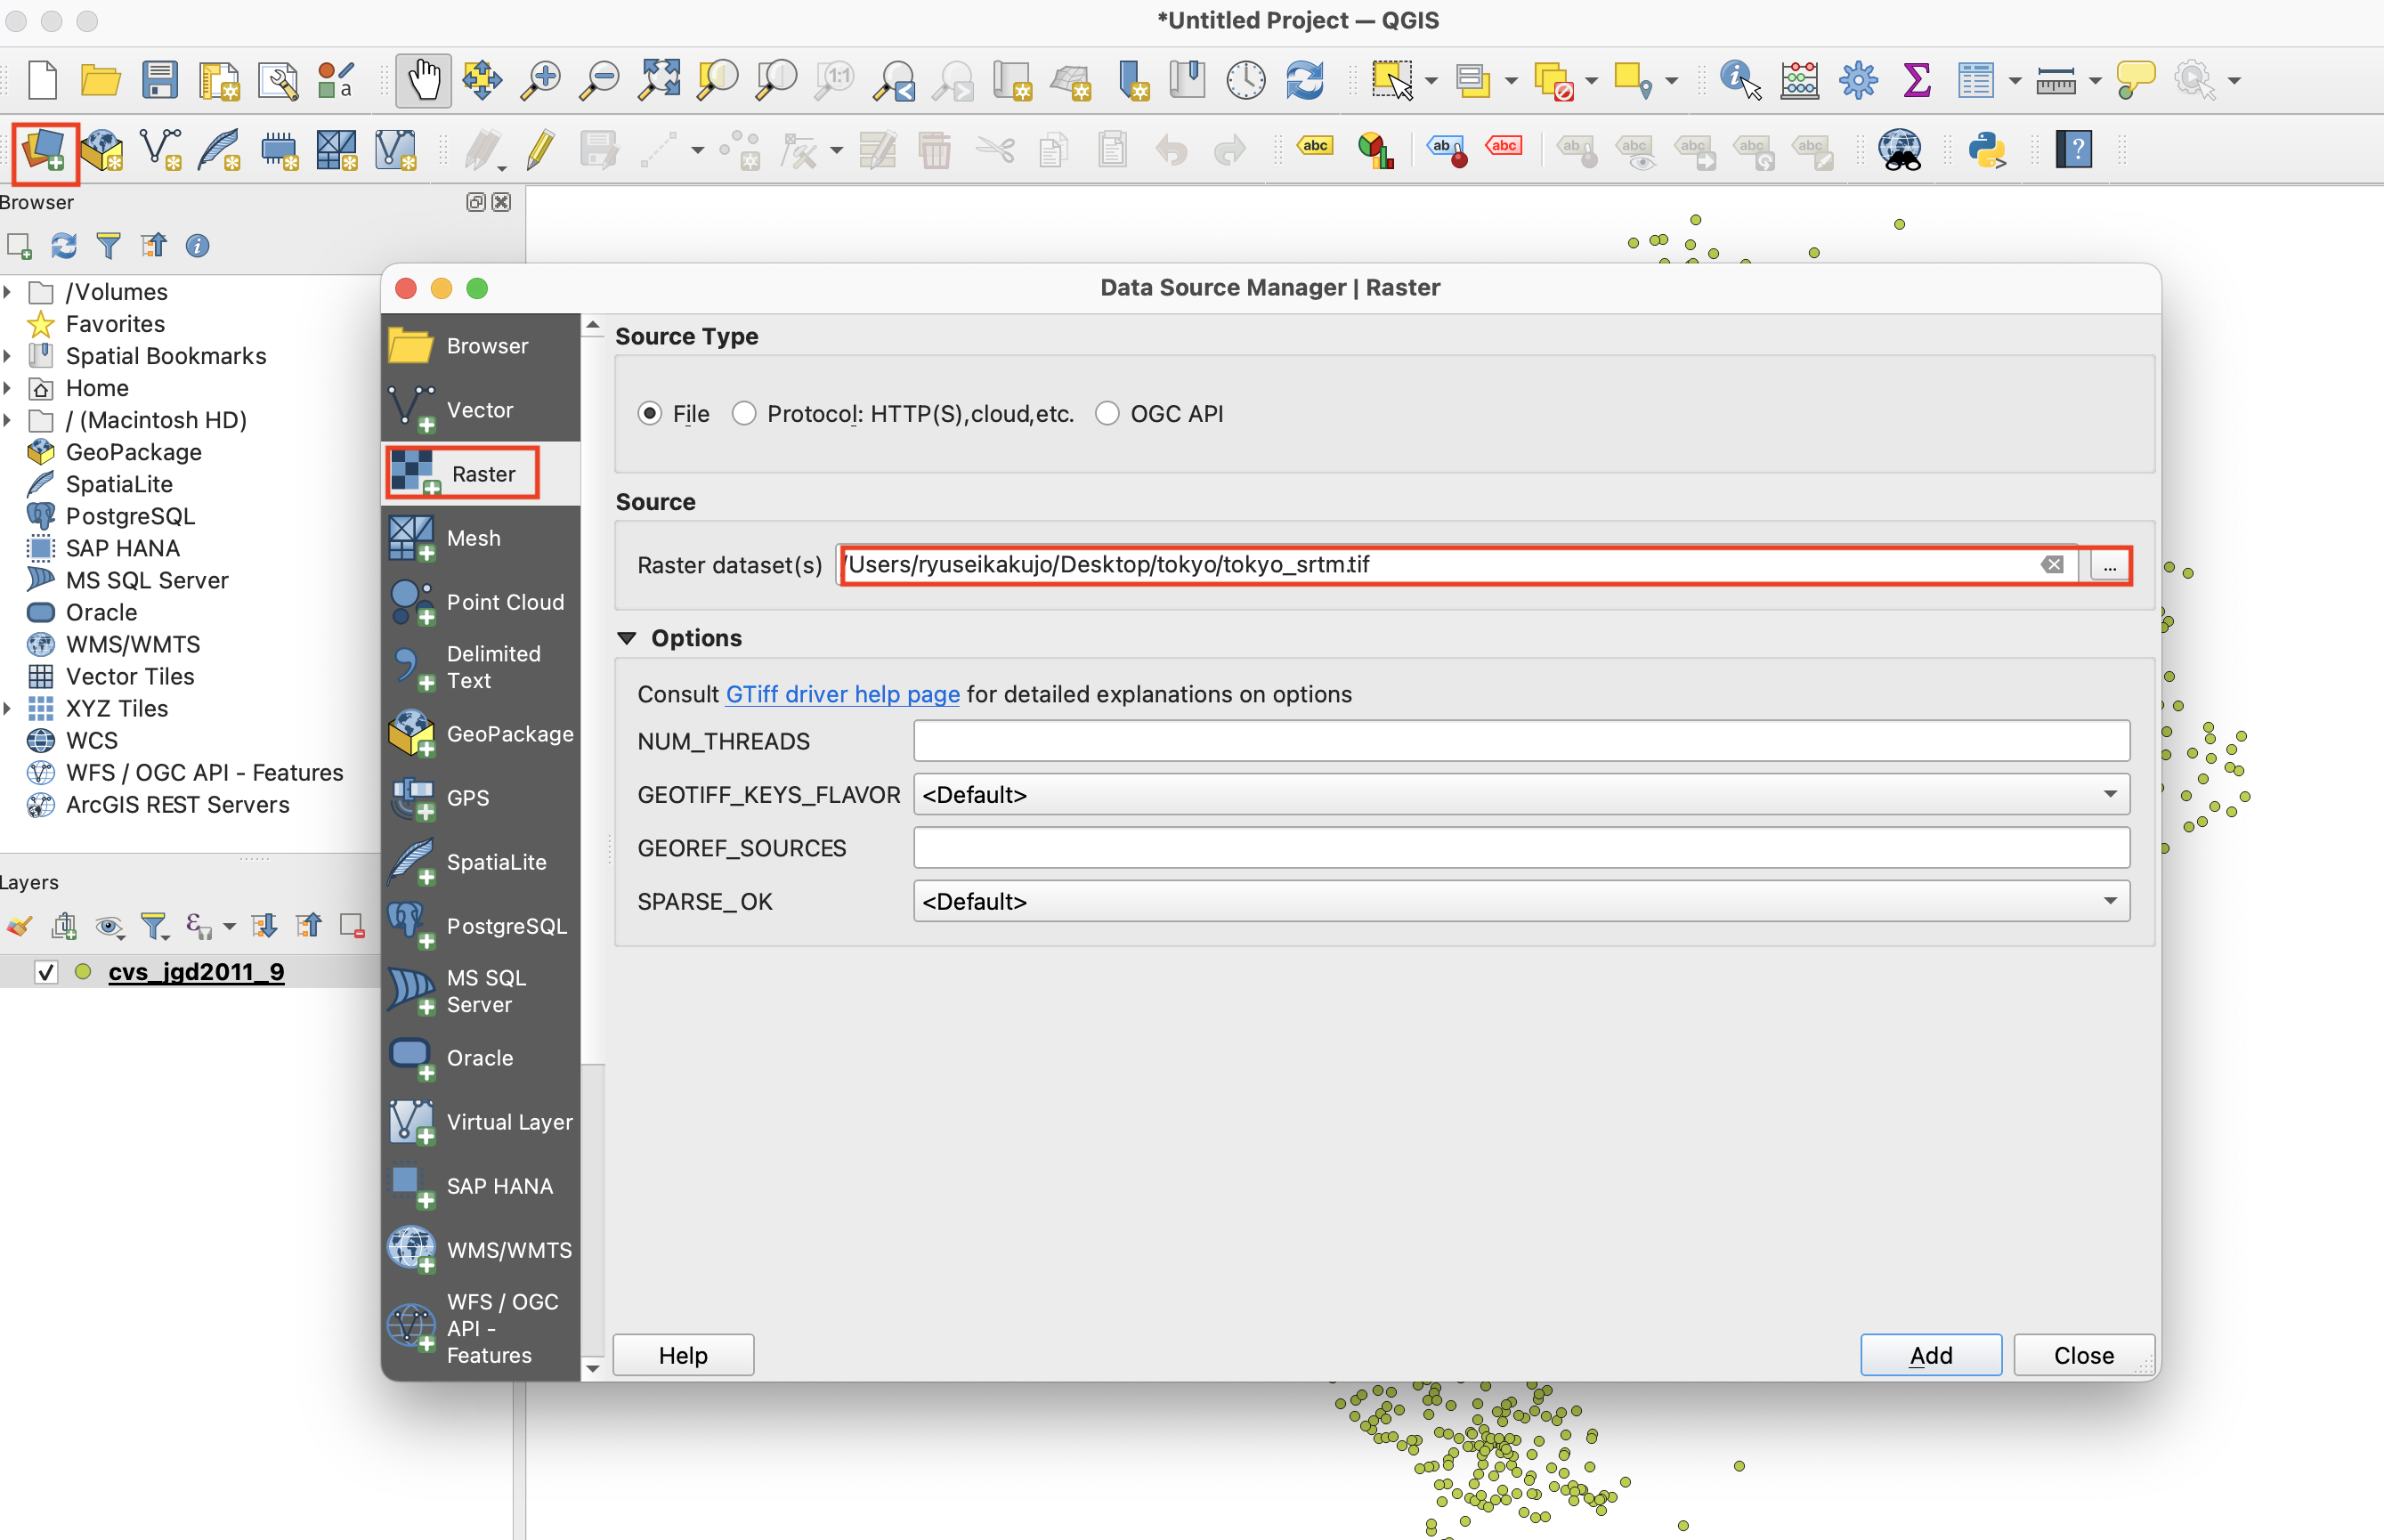
It will be displayed as shown in the capture below.


Ryusei Kakujo


Weave the future of cities through data
Transportation modeling/ Urban planning/ Machine learning/ Computer science/ GIS