

What is MLflow
MLflow is an OSS tool for managing ML lifecycles. Mlflow offers the following functions:
- MLFlow Tracking: experiment management
- MLFlow Projects: management of runtime environments
- MLFlow Models: deploy and pipeline your models
- MLFlow Model Registry: model versioning
This article deals with MLflow Tracking, an experiment management feature.
MLflow Tracking
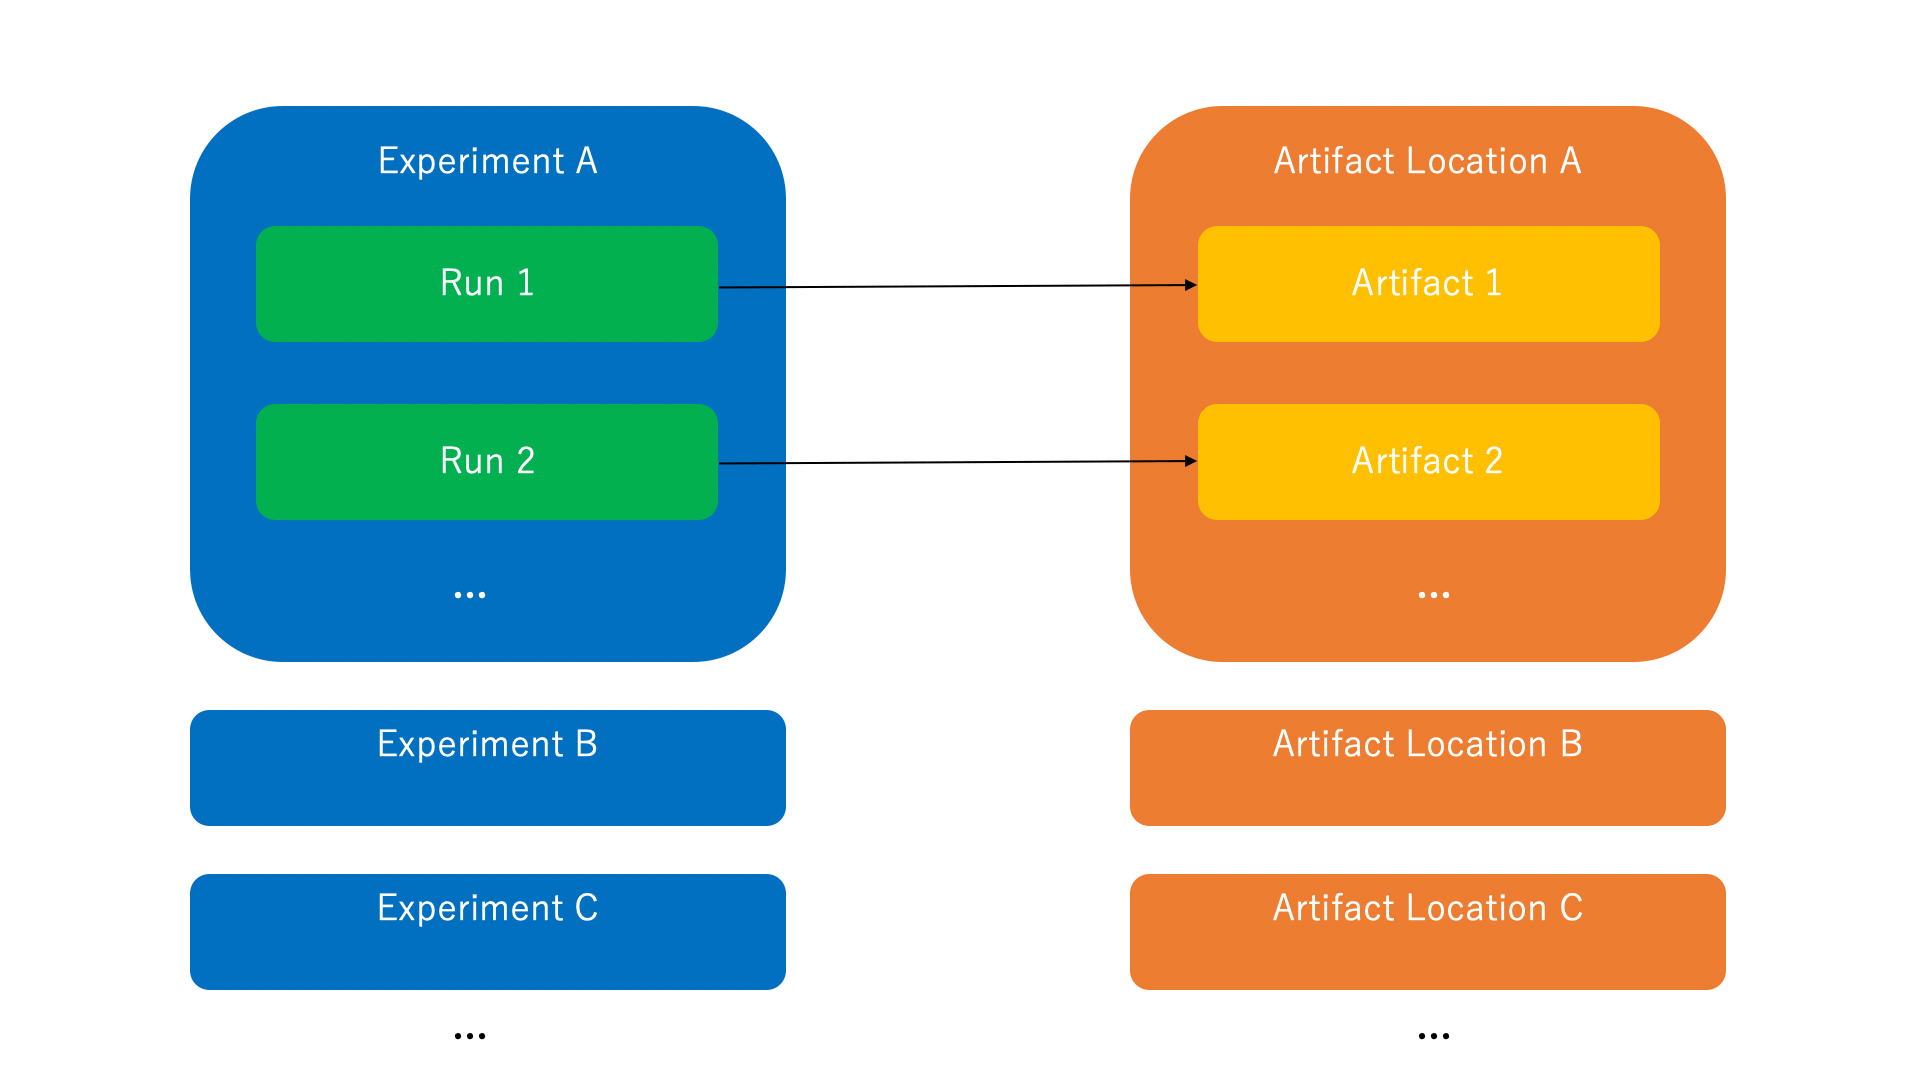
MLflow experiment management consists of the following three components.
- Run
A single trial (e.g., experiment, study) - Experiment
A group that binds the Runs together. - Artifact
Storage of output or intermediate products from a Run
Let's actually use MLflow Tracking. First, install the library.
$ pip install mlflow
Then save the following code in main.py and run it.
import os
from random import random, randint
from mlflow import log_metric, log_param, log_artifact, log_artifacts
if __name__ == "__main__":
# Log a parameter (key-value pair)
log_param("param1", randint(0, 100))
# Log a metric; metrics can be updated throughout the run
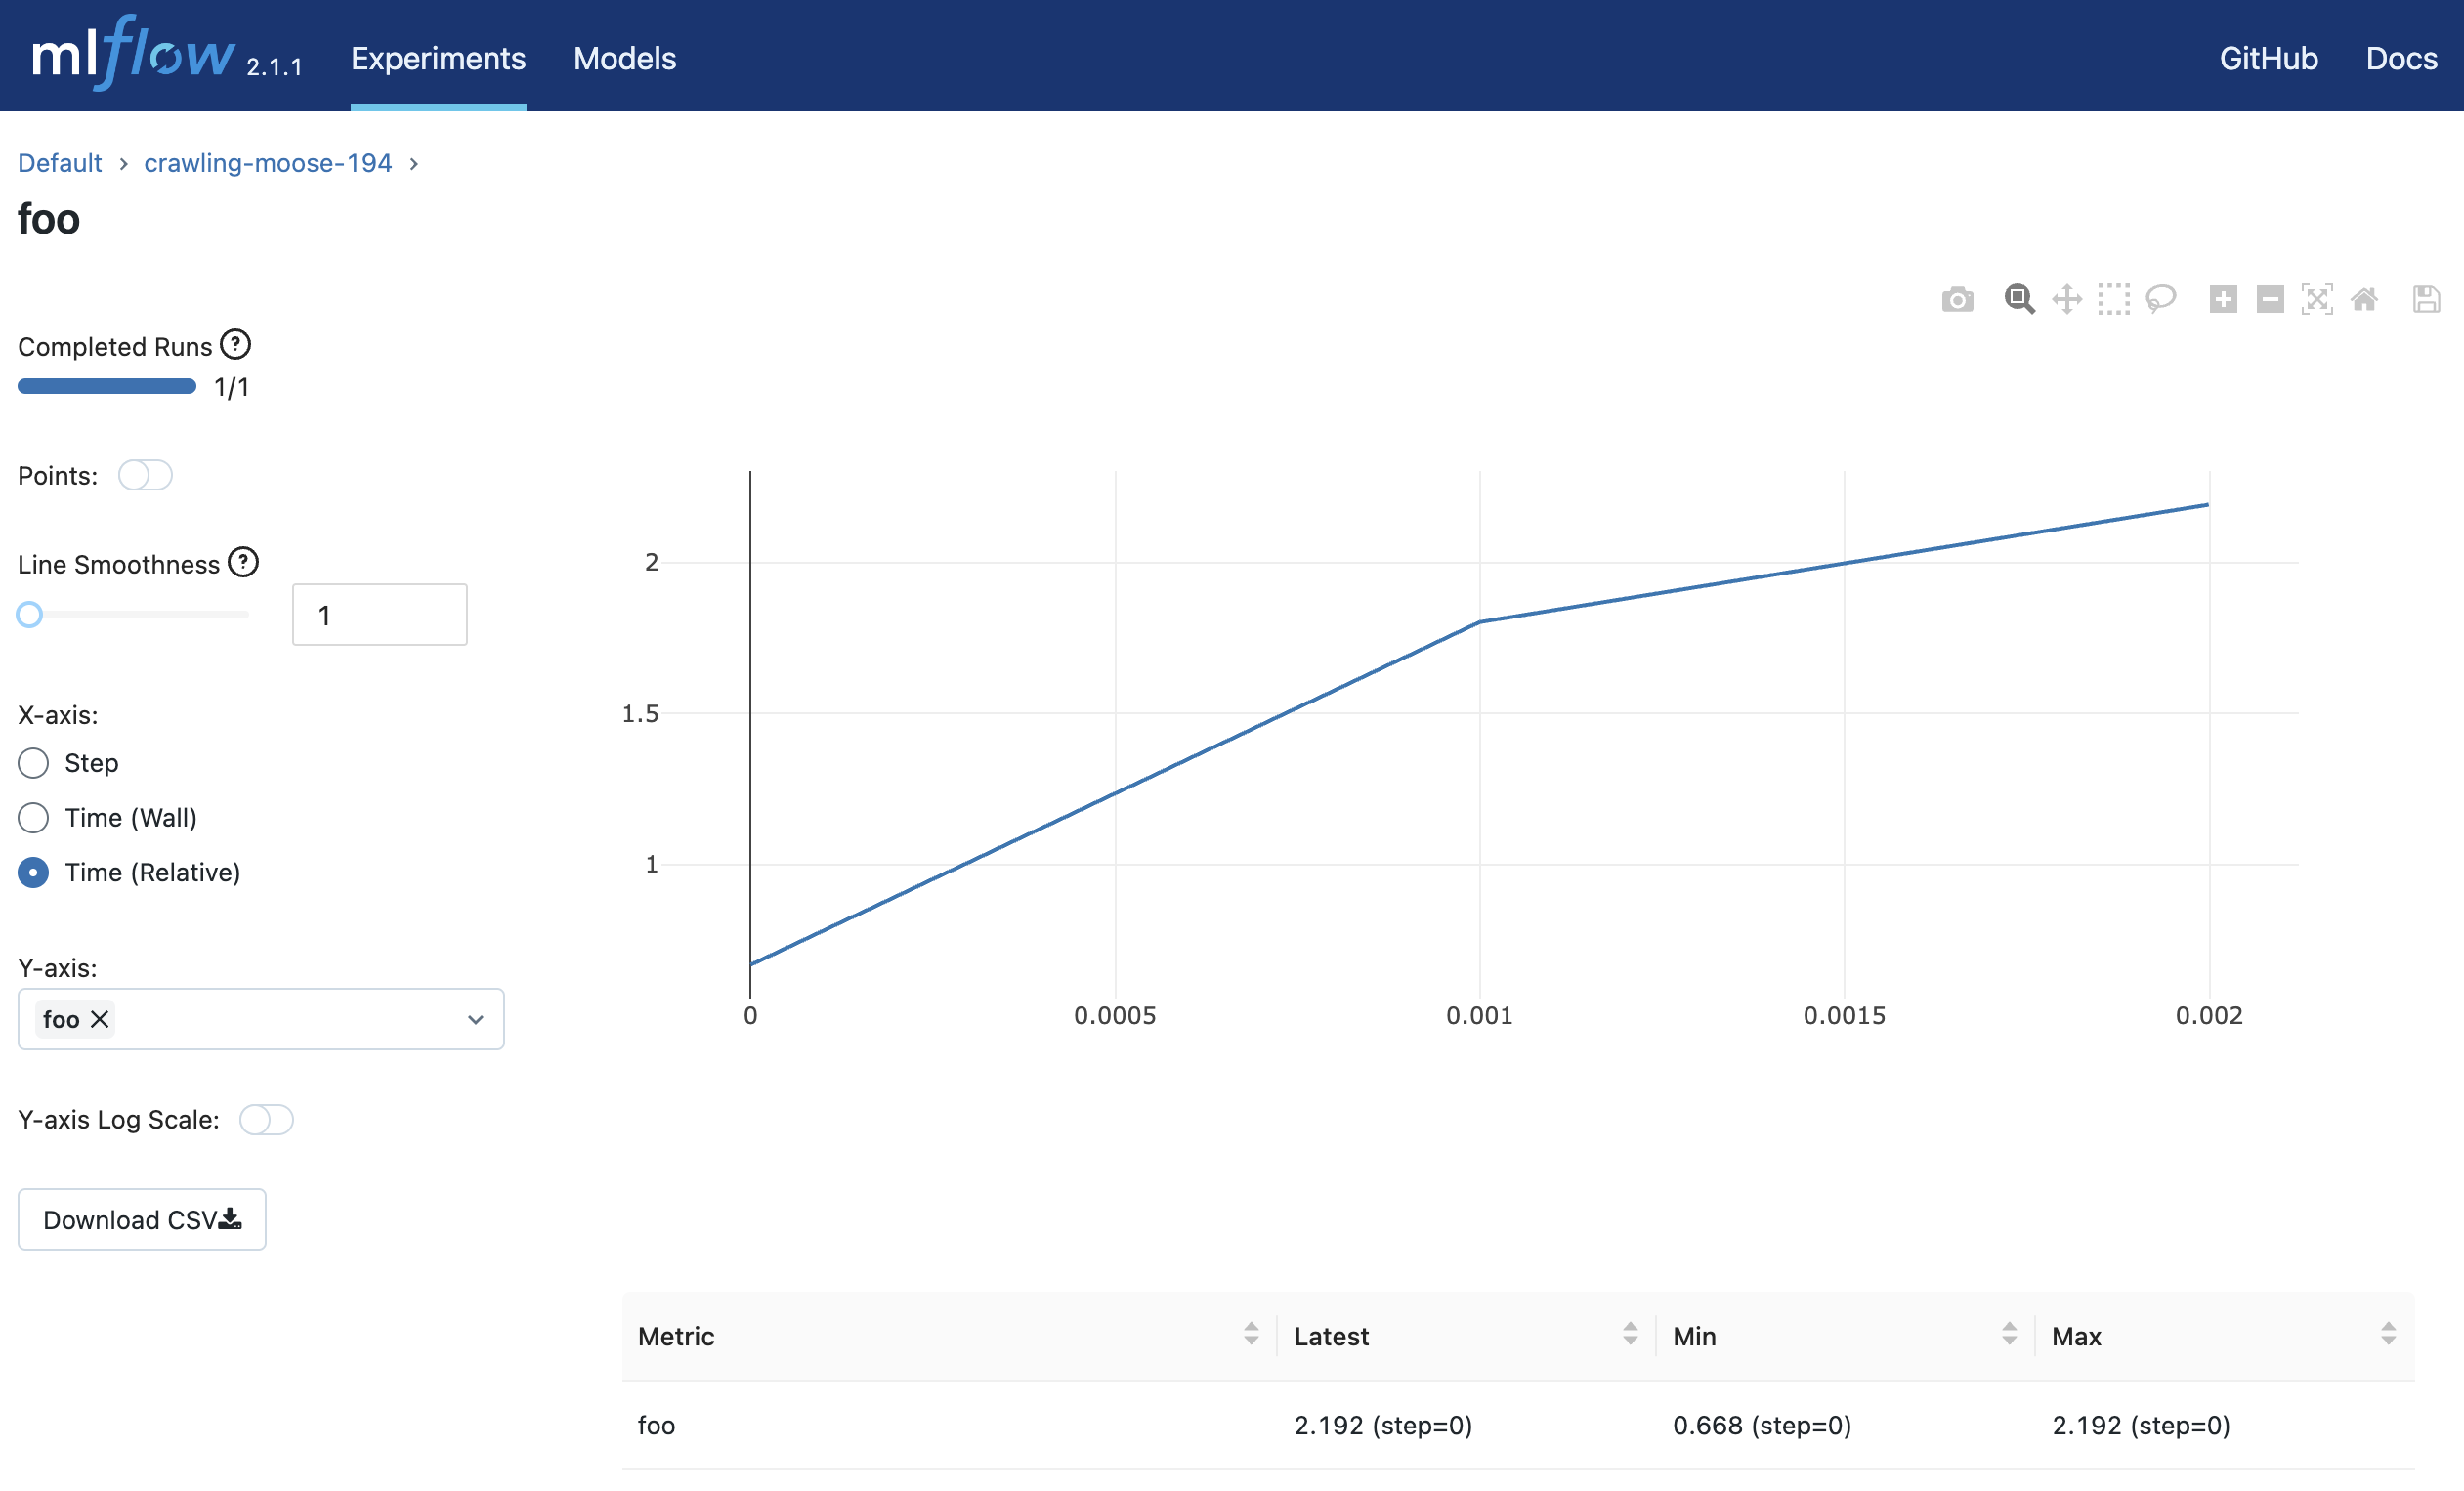
log_metric("foo", random())
log_metric("foo", random() + 1)
log_metric("foo", random() + 2)
# Log an artifact (output file)
if not os.path.exists("outputs"):
os.makedirs("outputs")
with open("outputs/test.txt", "w") as f:
f.write("Hello world!")
log_artifacts("outputs") # Record folder
$ python main.py
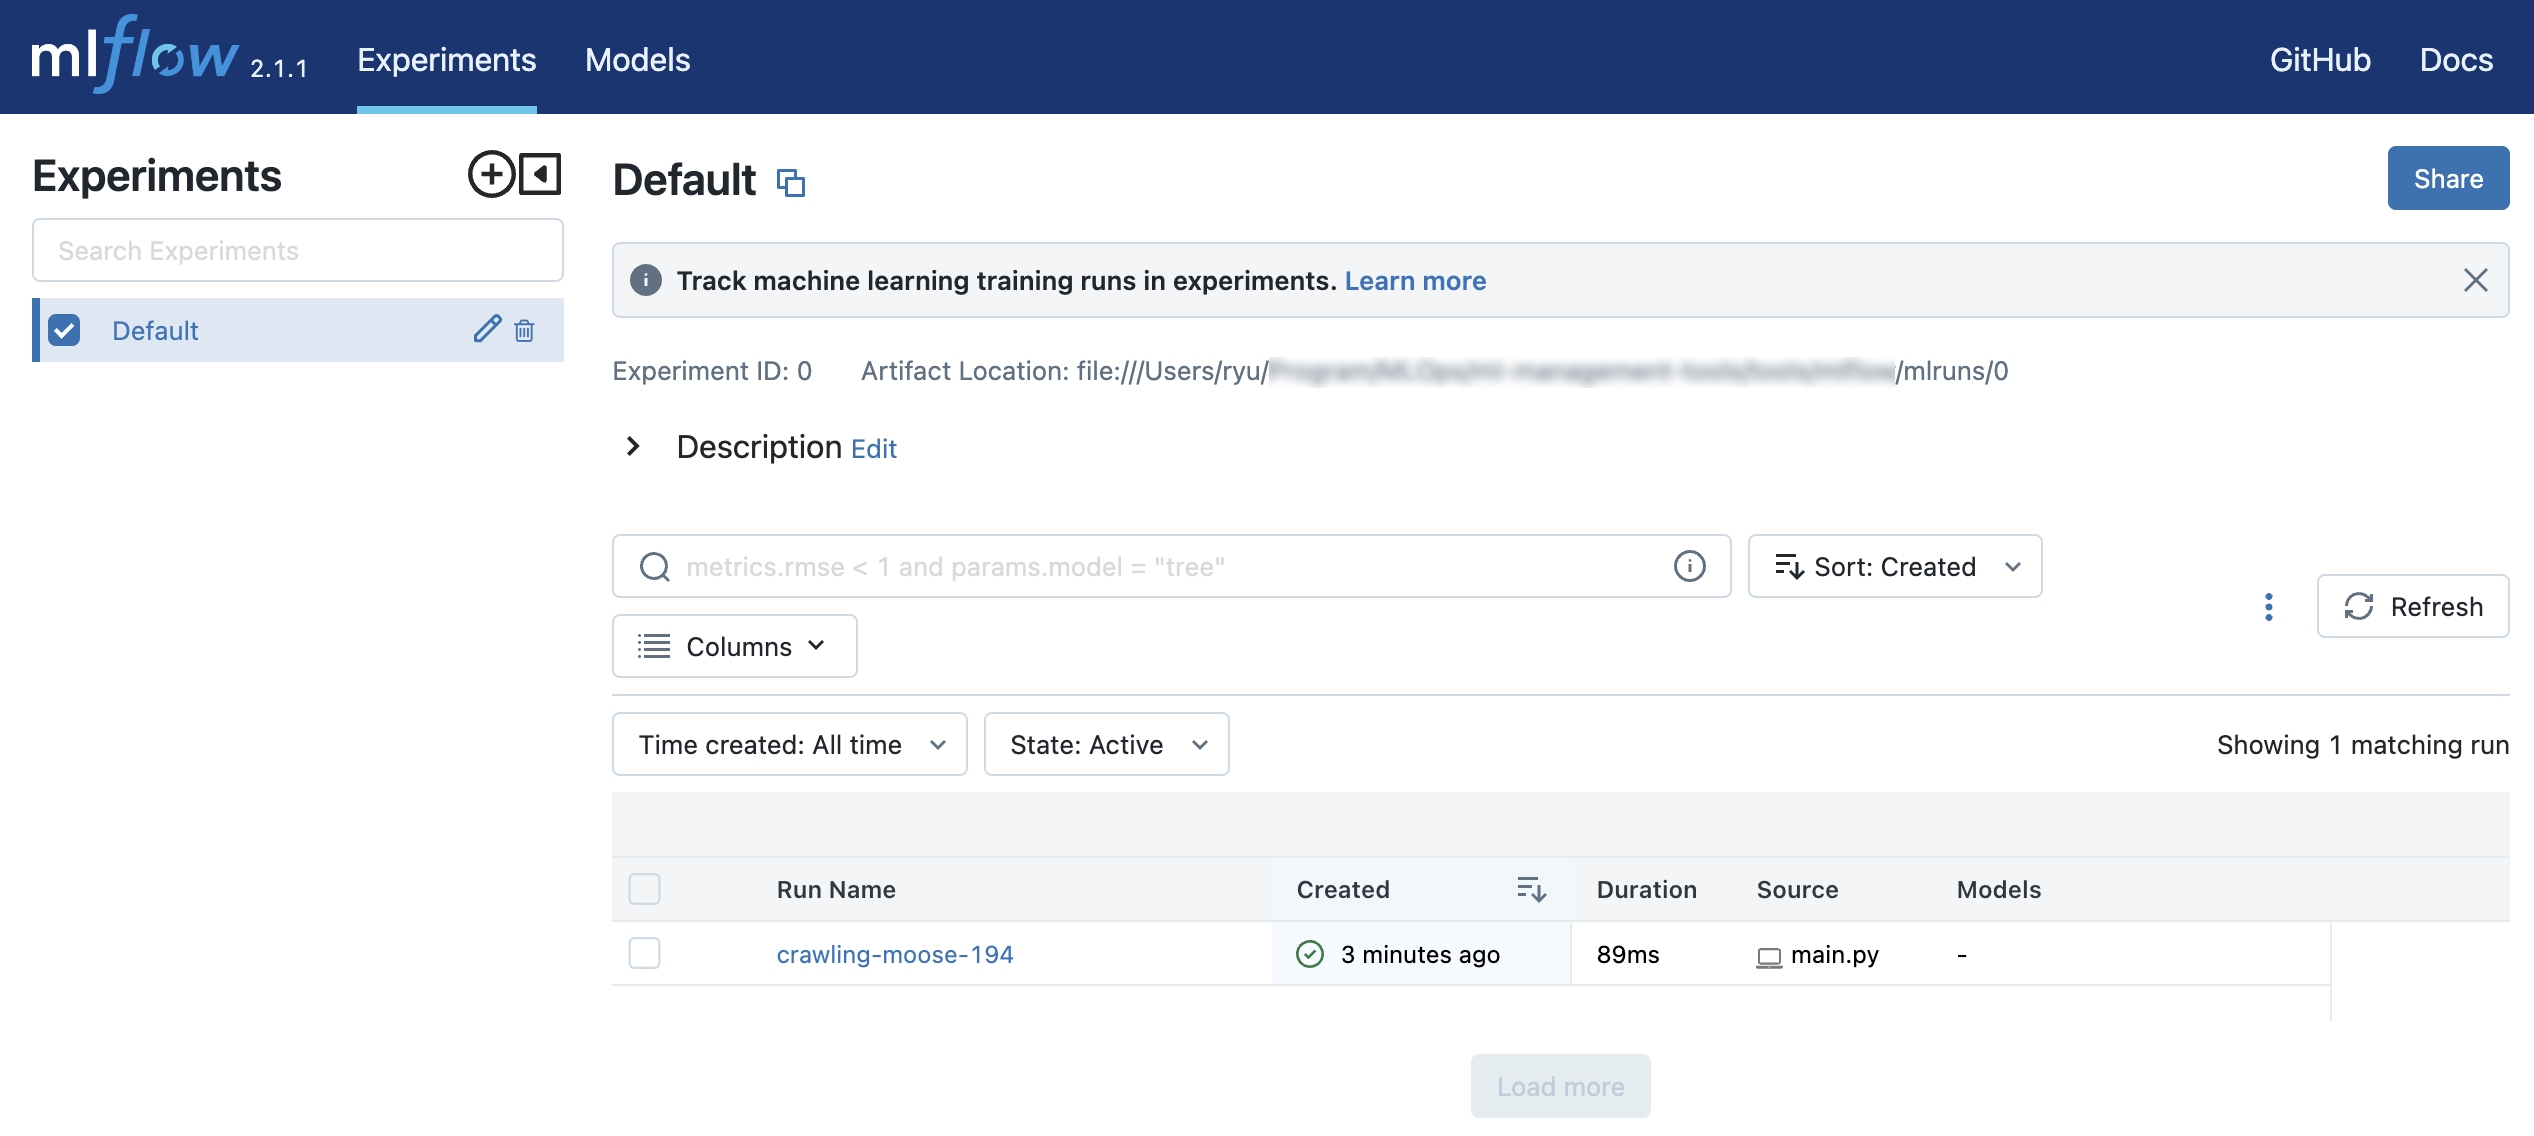
A mlruns folder and an outputs folder will be created.
.
├── __init__.py
├── main.py
├── mlruns
│   └── 0
│       ├── 21af48fda35a4aa1b61ef3622f71e4c0
│       │   ├── artifacts
│       │   │   └── test.txt
│       │   ├── meta.yaml
│       │   ├── metrics
│       │   │   └── foo
│       │   ├── params
│       │   │   └── param1
│       │   └── tags
│       │       ├── mlflow.runName
│       │       ├── mlflow.source.git.commit
│       │       ├── mlflow.source.name
│       │       ├── mlflow.source.type
│       │       └── mlflow.user
│       └── meta.yaml
└── outputs
    └── test.txt
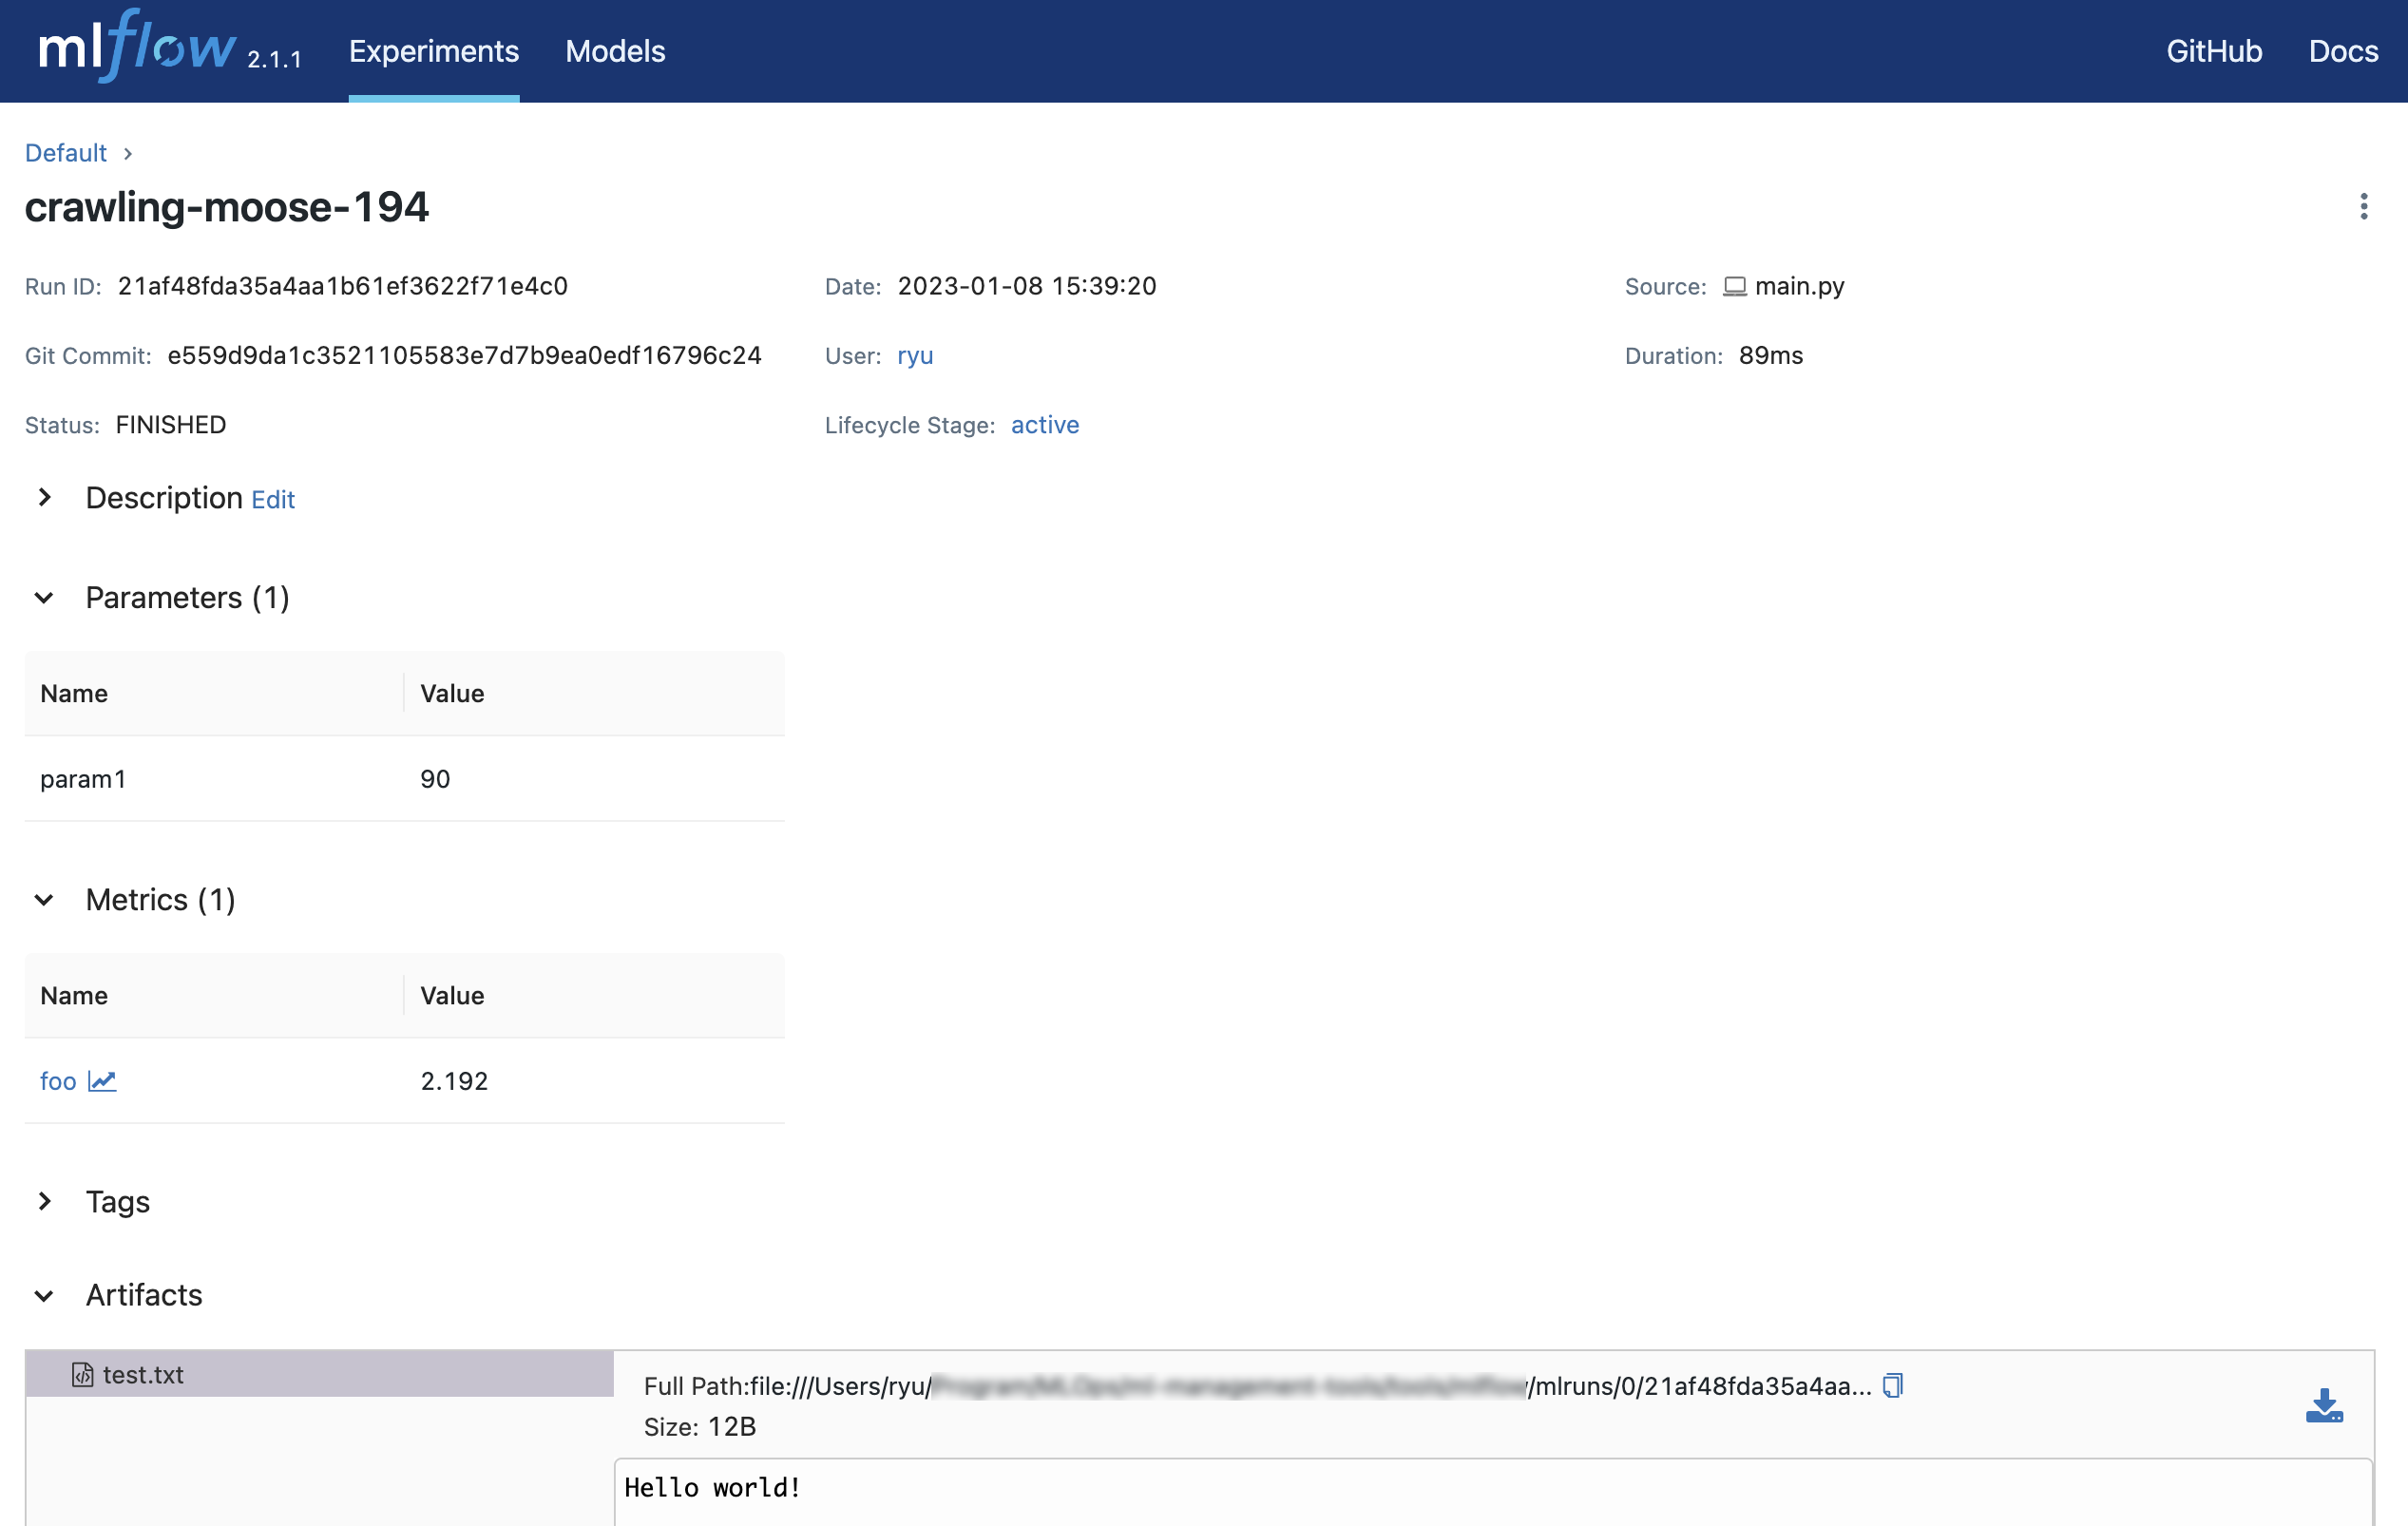
0 is the ID of Experiment and 21af48fda35a4aa1b61ef3622f71e4c0 is the ID of Run.
Run the mlflow ui command.
$ mlflow ui

[2023-01-08 15:41:46 +0900] [54928] [INFO] Starting gunicorn 20.1.0
[2023-01-08 15:41:46 +0900] [54928] [INFO] Listening at: http://127.0.0.1:5000 (54928)
[2023-01-08 15:41:46 +0900] [54928] [INFO] Using worker: sync
[2023-01-08 15:41:46 +0900] [54930] [INFO] Booting worker with pid: 54930
[2023-01-08 15:41:47 +0900] [54931] [INFO] Booting worker with pid: 54931
[2023-01-08 15:41:47 +0900] [54932] [INFO] Booting worker with pid: 54932
[2023-01-08 15:41:47 +0900] [54933] [INFO] Booting worker with pid: 54933
[2023-01-08 15:41:55 +0900] [54928] [INFO] Handling signal: winch
[2023-01-08 15:41:58 +0900] [54928] [INFO] Handling signal: winch
You can access http://127.0.0.1:5000 to view the results of the experiment in your browser.
Experiments to be controlled
In MLflow, the following four major values are controlled.
- Parameters
Parameters for experiment execution - Tags
Tags for experiment execution - Metrics
Metrics of the experiment - Artifacts
Files generated by the experiment
Logging functions
MLflow can log data to Run using Python, R, Java, or the REST API.
MLflow Tracking Server
You can use the mlflow server command to set up an MLflow Tracking server.
$ mlflow server \
    --backend-store-uri /mnt/persistent-disk \
    --default-artifact-root s3://my-mlflow-bucket/ \
    --host 0.0.0.0
The MLflow Tracking server has two storage-related components
- Backend Stores (
--backend-store-uri) - Artifact Stores (
--default-artifact-root)
Backend Stores
Backend Stores are places to store experiment and execution metadata, execution parameters, metrics, and tags.
The following Backend Stores can be specified in --backend-store-uri.
- Local file system
. /path_to_storefile:/path_to_store
- SQLAlchemy-compatible DB
<dialect>+<driver>://<username>:<password>@<host>:<port>/<database>
The default value of --backend-store-uri is . /mlruns.
Artifact Stores
Artifact Stores is where Artifacts are stored. Artifact Stores supports the following file systems
- Amazon S3
- Google Cloud Storage
- Azure Blob Storage
- FTP server
- SFTP Server
- NFS
- HDFS
--default-artifact-root specifies the default Artifact location.
Automatic logging
MLflow uses a feature called auto-logging to automatically log metrics, parameters, and models without explicitly writing logging code. The following libraries support automatic logging
- Scikit-learn
- Keras
- Gluon
- XGBoost
- LightGBM
- Statsmodels
- Spark
- Fastai
- Pytorch
There are two ways to use automatic logging:
- Call the
mlflow.autolog()function before the learning code - Call a library-specific function (e.g.
mlflow.sklearn.autolog())
The following code is an example of sklearn autologging.
import mlflow

from sklearn.model_selection import train_test_split
from sklearn.datasets import load_diabetes
from sklearn.ensemble import RandomForestRegressor

mlflow.autolog()

db = load_diabetes()
X_train, X_test, y_train, y_test = train_test_split(db.data, db.target)

# Create and train models.
rf = RandomForestRegressor(n_estimators = 100, max_depth = 6, max_features = 3)
rf.fit(X_train, y_train)

# Use the model to make predictions on the test dataset.
predictions = rf.predict(X_test)
autolog_run = mlflow.last_active_run()
LightGBM experiments
Let's experiment with LightGBM classification of iris datasets.
First, set up a MLflow Tracking server.
$ mlflow server \
  --backend-store-uri ./mlruns \
  --default-artifact-root gs://GCS_BUCKET/mlruns \
  --host 0.0.0.0
Then run the following code twice.
from datetime import datetime
import lightgbm as lgb
from sklearn import datasets
from sklearn.model_selection import train_test_split
import mlflow

params = dict(
    test_size=0.2,
    random_state=42,
)

iris = datasets.load_iris()
X, y = iris.data, iris.target
X_train, X_test, y_train, y_test = train_test_split(X, y, **params)

lgb_params = dict(
    learning_rate=0.05,
    n_estimators=500,
)
model = lgb.LGBMClassifier(**lgb_params)

def mlflow_callback():
    def callback(env):
        for name, loss_name, loss_value, _ in env.evaluation_result_list:
            mlflow.log_metric(key=loss_name, value=loss_value, step=env.iteration)
    return callback

mlflow.set_tracking_uri("http://127.0.0.1:5000")
mlflow.set_experiment("EXP-1")

with mlflow.start_run(run_name=str(datetime.now())):
    mlflow.log_params({**params, **lgb_params})
    model.fit(
        X_train,
        y_train,
        eval_set=(X_test, y_test),
        eval_metric=["softmax"],
        callbacks=[
            lgb.early_stopping(10),
            mlflow_callback(),
        ])
    # Log an artifact (output file)
    with open("output.txt", "w") as f:
        f.write("Hello world!")
    mlflow.log_artifact("output.txt")
$ lightgbm_experiment.py
$ lightgbm_experiment.py
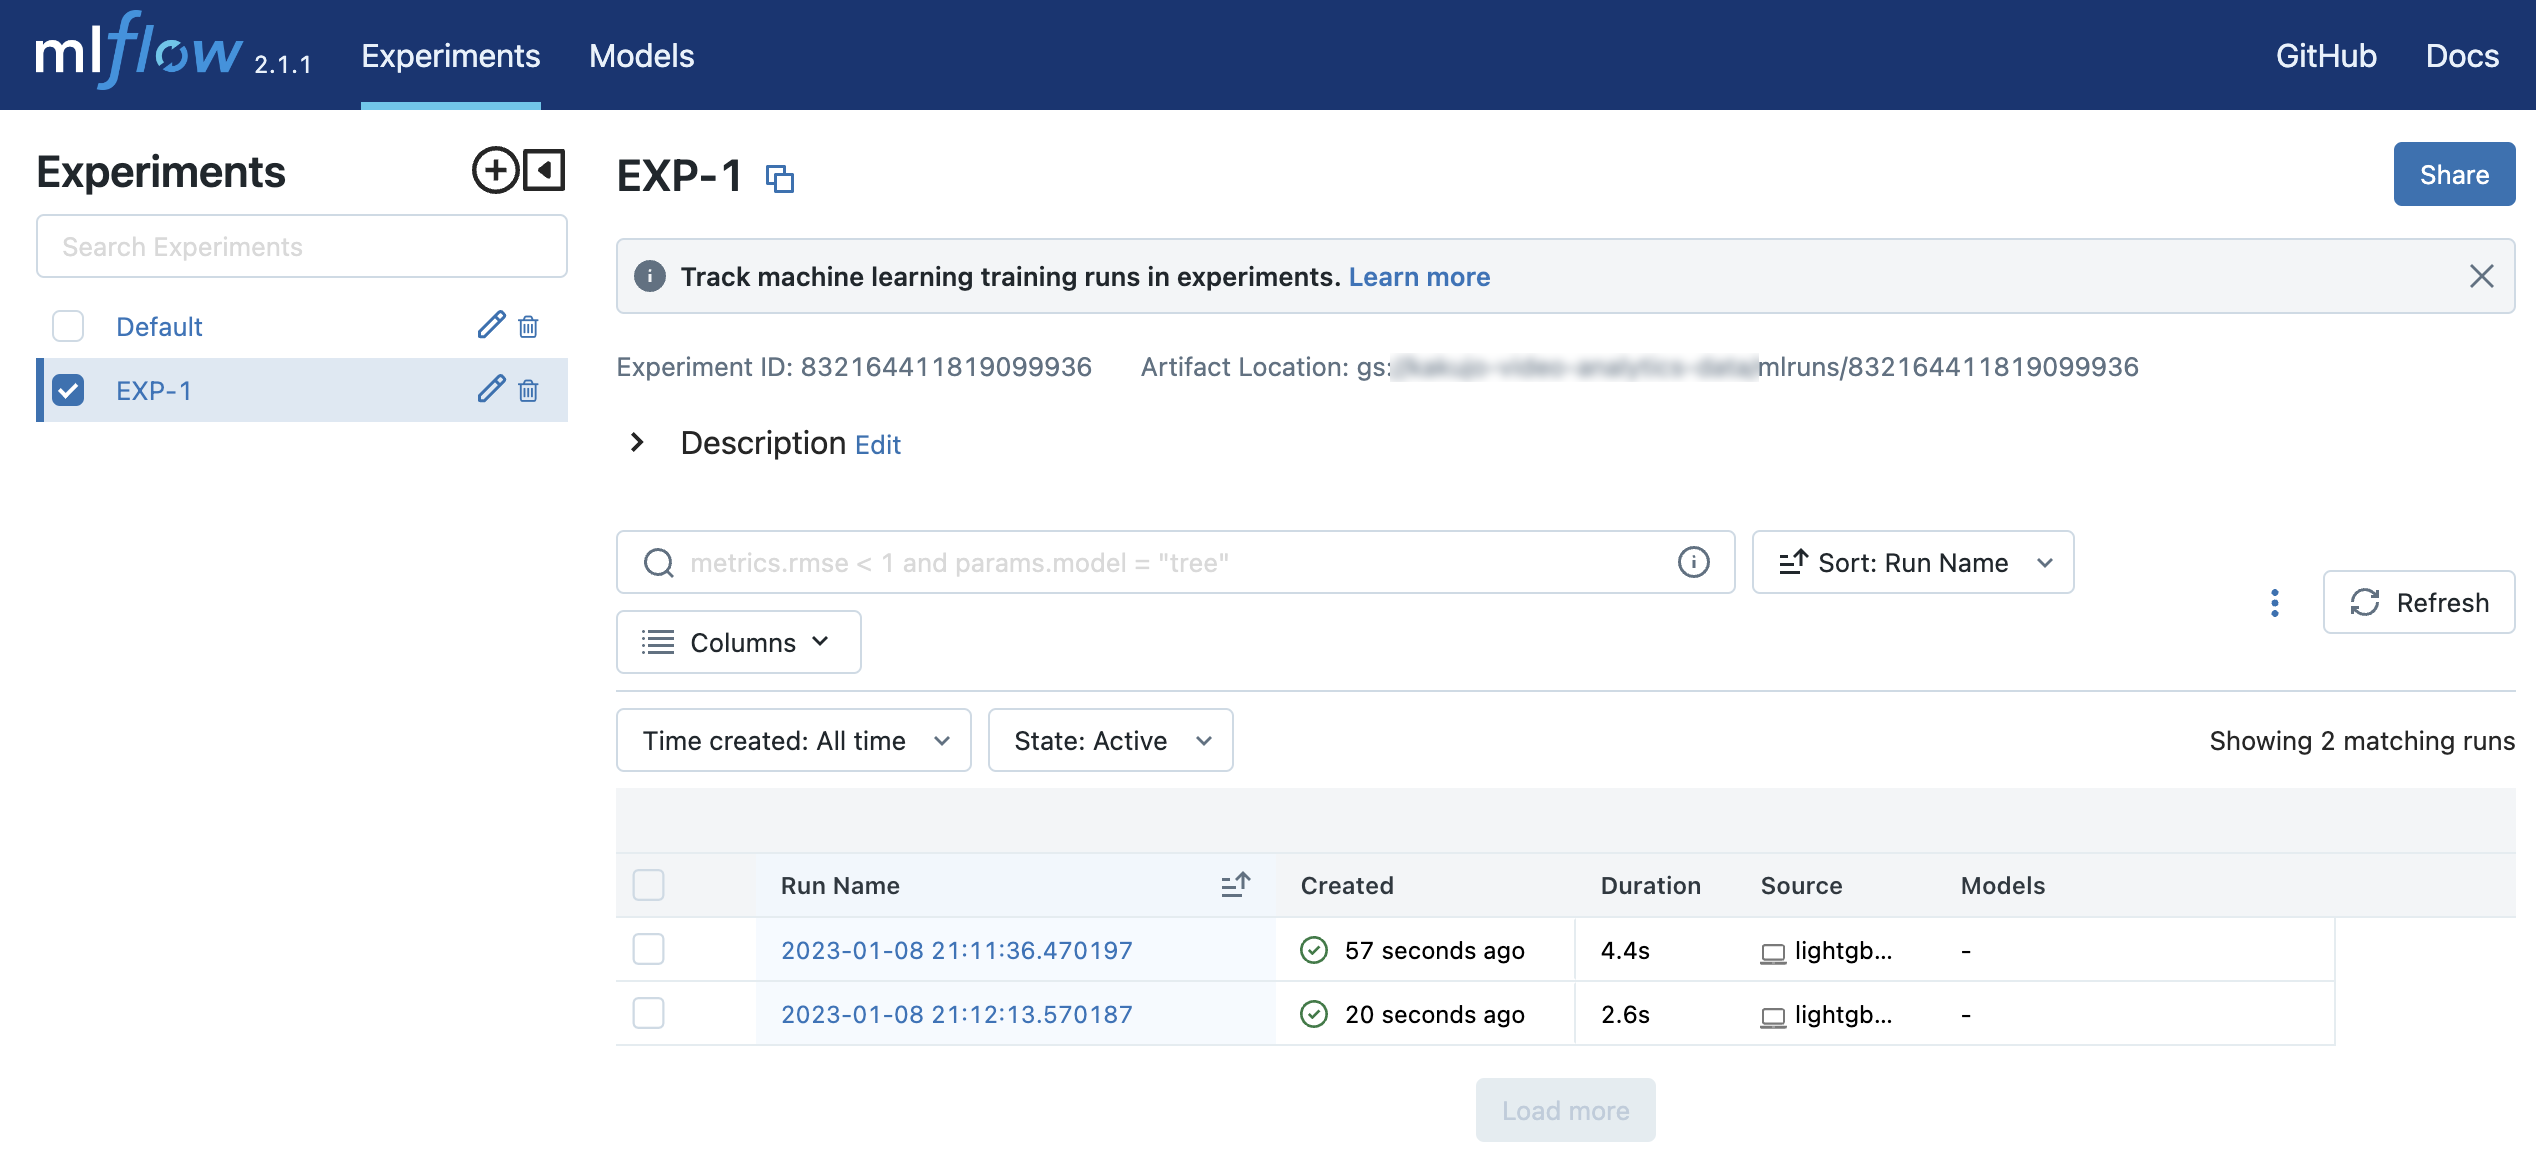
When you go to http://127.0.0.1:5000, you will see two Runs in an Experiment called EXP-1.
References


Ryusei Kakujo


Weave the future of cities through data
Transportation modeling/ Urban planning/ Machine learning/ Computer science/ GIS