

What is Lorenz Curve
The Lorenz Curve is a graphical representation of the distribution of wealth or income within a population. It was named after the American economist Max O. Lorenz, who developed this concept in 1905. The Lorenz Curve provides a clear visualization of the degree of inequality and enables comparisons between different societies, economies, or time periods.
Construction of Lorenz Curve
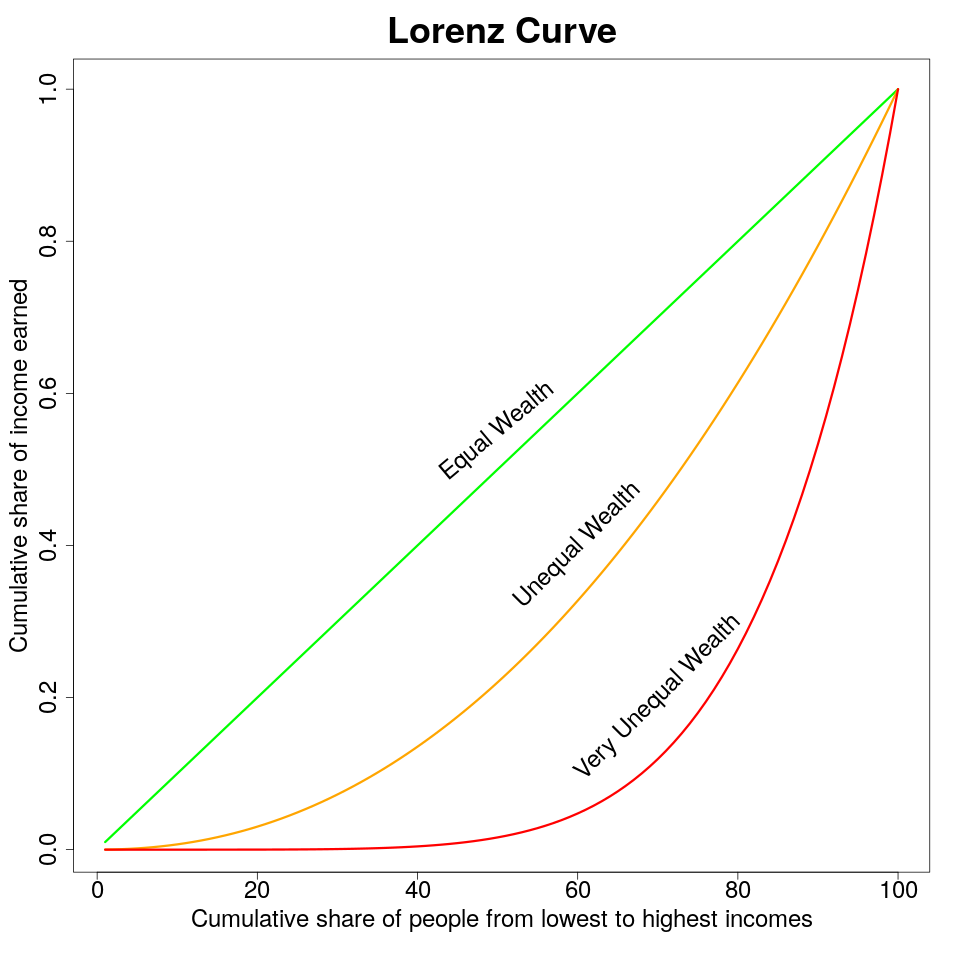
The construction of a Lorenz Curve starts by arranging the population from the poorest to the wealthiest. The x-axis represents the cumulative percentage of the population, and the y-axis shows the cumulative percentage of total income or wealth.
The graph begins with a 45-degree line, known as the line of perfect equality. If every household earned the same income, the Lorenz Curve would coincide with this line. In other words, the bottom 10% of households would have 10% of the total income, the bottom 20% would have 20% of the income, and so forth, until we reach 100%.
The actual Lorenz Curve falls below the line of equality, demonstrating the reality of income or wealth distribution. The shape of this curve represents the disparity in distribution. For example, if the bottom 40% of households only have 10% of total income, the Lorenz curve would dip significantly below the line of equality at this point.
Interpretation of Lorenz Curve
The Lorenz Curve is a powerful tool for interpreting economic inequality. The curve's deviation from the line of equality measures the extent of inequality: the greater the bowing of the Lorenz Curve from the line of perfect equality, the higher the level of inequality in the distribution of income or wealth.
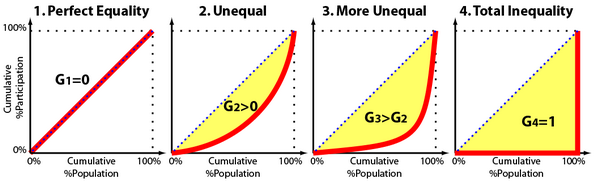
If the Lorenz Curve coincides with the line of perfect equality, it signifies perfect equality in the distribution of income or wealth. On the other hand, if the Lorenz Curve coincides with the axes (a right-angle curve), it represents maximum inequality, which would mean that one person has all the income or consumption, and all others have none.
What is Gini Coefficient
The Gini Coefficient, named after the Italian statistician Corrado Gini, is a measure of statistical dispersion intended to represent the income or wealth distribution of a nation's residents. This coefficient is a number between 0 and 1, where 0 corresponds with perfect equality, where everyone has the same income, and 1 corresponds with perfect inequality, where one person has all the income, and everyone else has none.
Clearly Explained: Gini coefficient and Lorenz curve
Calculation of Gini Coefficient
The Gini Coefficient is derived from the Lorenz curve. The coefficient is the ratio of the area that lies between the line of equality (the 45-degree line) and the Lorenz curve over the total area under the line of equality.
Mathematically, if
The integral represents the area under the Lorenz curve. The entire area under the line of equality is a triangle with an area of 0.5, so twice the integral is the proportion of the area under the line of equality that is also under the Lorenz curve. Subtracting this from 1 gives the Gini coefficient.
Applications of Gini Coefficient
The Gini Coefficient is widely used in various fields to measure inequality. In economics, it is used to measure the inequality in income distribution or distribution of wealth. In health, it is used to understand the disparity in healthcare delivery. Ecologists use the Gini coefficient to express biodiversity. It is a vital tool for sociologists to measure inequality of social parameters.
The Gini Coefficient also plays an important role in policy making. Policymakers can use the measure to decide where to channel resources to address social and economic inequalities in a population.
References


Ryusei Kakujo


Weave the future of cities through data
Transportation modeling/ Urban planning/ Machine learning/ Computer science/ GIS