


Introduction
Decision trees are a popular choice among machine learning algorithms due to their simplicity, interpretability, and ease of visualization. A critical aspect of decision trees is their ability to automatically select and rank the most relevant features in a dataset. This process, called feature importance, aids in simplifying complex datasets and identifying the most significant variables. In this article, I will delve deeper into the concept of feature importance in decision trees and discuss various methods used to calculate it, such as Gini impurity, information gain, and gain ratio.
Gini Impurity
Gini impurity is a measure of how often a randomly chosen element from the dataset would be incorrectly labeled if it were randomly labeled according to the distribution of labels in the subset. The Gini impurity is calculated for each feature, and the decision tree algorithm selects the feature with the lowest Gini impurity to split the dataset at each node. The overall importance of a feature is determined by the cumulative reduction in Gini impurity it brings about throughout the tree.
Mathematically, the Gini impurity for a dataset
where
The Gini impurity is used to decide which feature to split on at each node in the decision tree. The feature that results in the lowest weighted average Gini impurity after splitting is chosen.
Information Gain
Information gain is another method used to calculate feature importance in decision trees. This approach is based on the concept of entropy, which is a measure of the randomness or disorder in a dataset. Information gain calculates the reduction in entropy that results from splitting a dataset based on a specific feature. The feature that results in the highest information gain is selected to split the dataset at each node. The overall importance of a feature is determined by the cumulative information gain it provides throughout the tree.
The entropy of a dataset
where
Information gain can be calculated using the formula:
where
Gain Ratio
Gain ratio is a variation of information gain that takes into account the intrinsic information of a feature. It addresses the bias towards features with a large number of distinct values in information gain. The gain ratio is calculated by dividing the information gain by the intrinsic information of a feature. The feature with the highest gain ratio is chosen for splitting at each node, and the overall importance of a feature is determined by the cumulative gain ratio it provides throughout the tree.
The intrinsic information of a feature
where
The gain ratio can then be calculated using the formula:
Visualizing Feature Importance
In this section, I will demonstrate how to visualize feature importance in both regression and classification cases using Python.
First, let's import the necessary libraries and create the datasets:
import numpy as np
import matplotlib.pyplot as plt
from sklearn.datasets import make_regression, make_classification
from sklearn.tree import DecisionTreeRegressor, DecisionTreeClassifier
from sklearn.model_selection import train_test_split

# Create synthetic datasets for regression and classification
X_reg, y_reg = make_regression(n_samples=1000, n_features=10, n_informative=5, random_state=42)
X_clf, y_clf = make_classification(n_samples=1000, n_features=10, n_informative=5, random_state=42)

# Split the datasets into train and test sets
X_reg_train, X_reg_test, y_reg_train, y_reg_test = train_test_split(X_reg, y_reg, test_size=0.3, random_state=42)
X_clf_train, X_clf_test, y_clf_train, y_clf_test = train_test_split(X_clf, y_clf, test_size=0.3, random_state=42)
Now, let's create and train the decision tree models for regression and classification:
# Create and train decision tree models
regressor = DecisionTreeRegressor(random_state=42)
classifier = DecisionTreeClassifier(random_state=42)

regressor.fit(X_reg_train, y_reg_train)
classifier.fit(X_clf_train, y_clf_train)
Once the models are trained, we can obtain the feature importance values and visualize them:
# Get feature importance values for regression and classification models
reg_importance = regressor.feature_importances_
clf_importance = classifier.feature_importances_

# Function to visualize feature importance
def plot_feature_importance(importances, title):
    indices = np.argsort(importances)[::-1]
    plt.figure()
    plt.title(title)
    plt.bar(range(len(importances)), importances[indices], align='center')
    plt.xticks(range(len(importances)), indices)
    plt.xlabel('Feature Index')
    plt.ylabel('Feature Importance')
    plt.show()

# Visualize feature importance for regression and classification
plot_feature_importance(reg_importance, 'Feature Importance for Regression')
plot_feature_importance(clf_importance, 'Feature Importance for Classification')
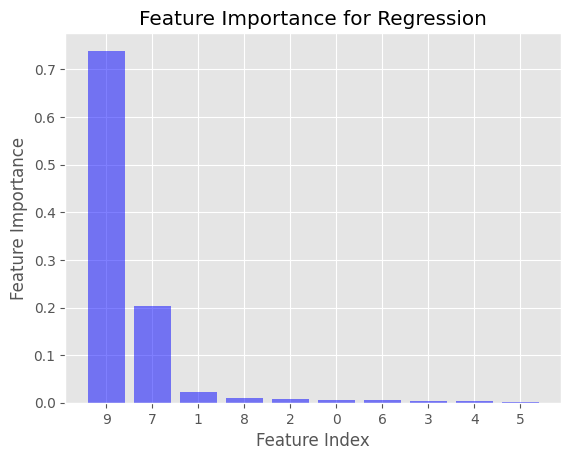
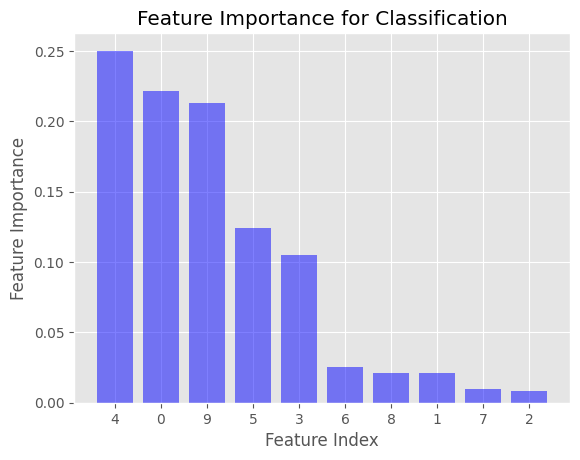
This will generate two bar plots displaying the feature importance values for the regression and classification cases. The x-axis represents the feature index, and the y-axis represents the feature importance value. The features are sorted in descending order of importance.
In the examples provided, the feature importance is computed using Gini impurity for the DecisionTreeClassifier and mean squared error (MSE) for the DecisionTreeRegressor. These are the default impurity criteria used in the Scikit-learn library when creating decision trees.
You can change the impurity criterion for both DecisionTreeRegressor and DecisionTreeClassifier by specifying the criterion parameter when creating the decision tree models. For the DecisionTreeClassifier, you can set the criterion parameter to 'entropy' to use information gain instead of Gini impurity. For the DecisionTreeRegressor, you can set the criterion parameter to 'mae' (mean absolute error) if you prefer to use a different measure of impurity. However, Scikit-learn does not support the gain ratio as an impurity criterion directly.
References


Ryusei Kakujo


Weave the future of cities through data
Transportation modeling/ Urban planning/ Machine learning/ Computer science/ GIS